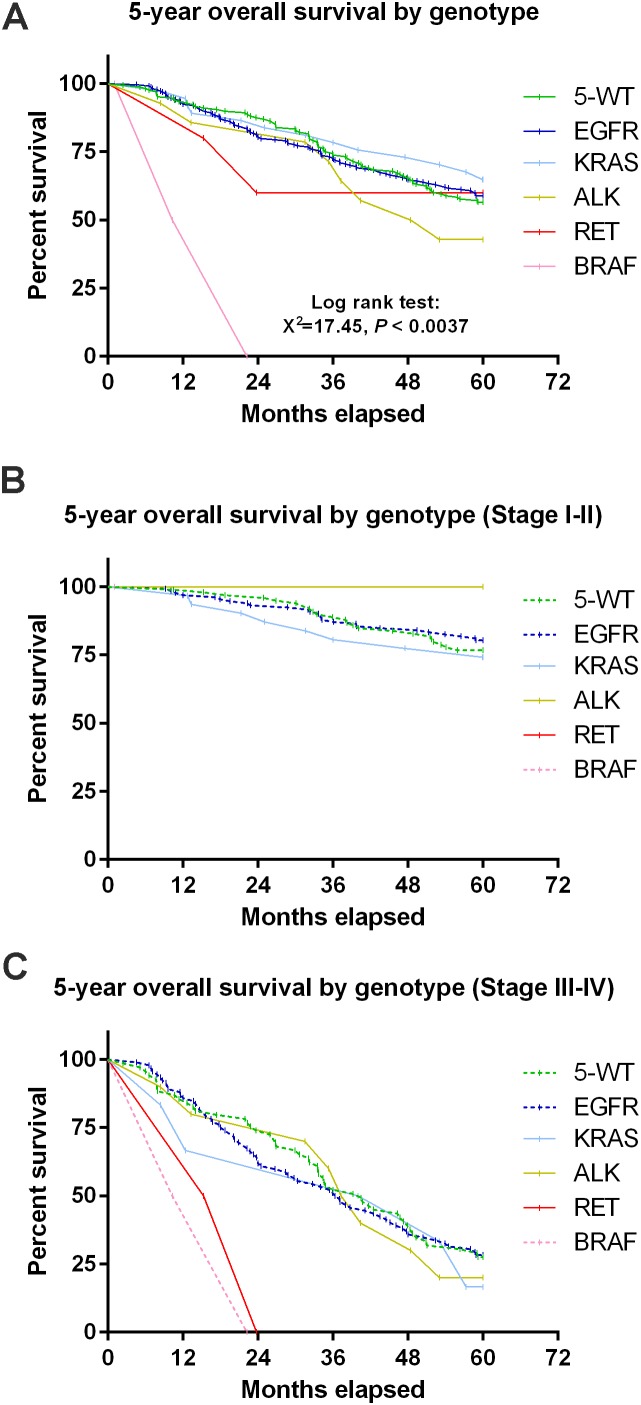
Figure 2. Genetic mutation-induced variation in prognosis was stage-dependent.
(A) Survival curve of 5-year OS by genotype showed that patients with BRAF mutations had a significantly worse OS than patients with other genotypes. (B) Survival curve showed that there was no significant difference in 5-year OS among stage I-II patients with different genotypes. (C) Patients with BRAF or RET mutations showed a significantly worse OS than patients with other genotypes at stage III/IV. *P < 0.05 considered as statistically significant.

