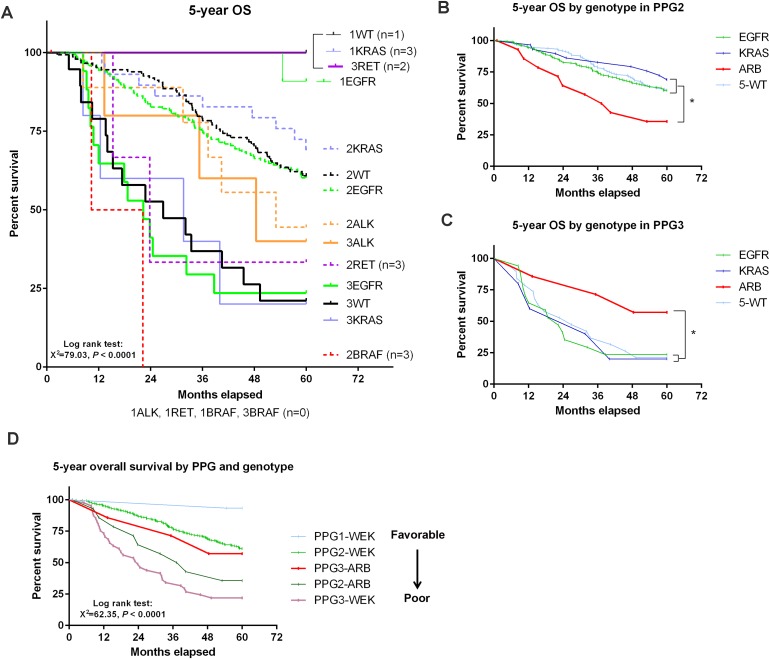
Figure 3. Overall survival determined by both PPG and genetic mutations.
(A) Survival curve plotted based on both PPG and genotype. 1, 2, and 3 denote PPG1, 2, and 3, respectively. (B-C) Survival curves by genotypes (ALK, RET, and BRAF were grouped together as ARB) in PPG2 (B) and PPG3 (C) patients. (D) Survival curve according to PPG and combined genotypes (ARB=ALK+RET+BRAF and WEK=WT+EGFR+KRAS). The order of prognosis from favorable to poor is indicated in the right panel. *P < 0.05 considered as statistically significant.

