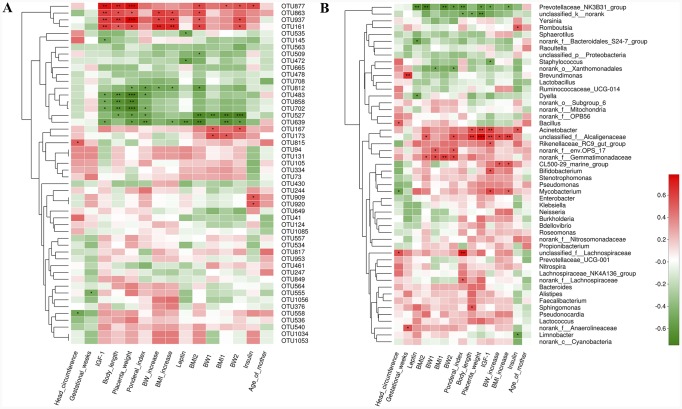
Figure 7. Correlation analyses between relative abundance (%) of placental microbiota and clinical parameters at the OTU and genus level.
(A) OTUs that were significantly correlated with clinical parameters. (B) Correlation analysis between identified genera and clinical parameters. Correlation analyses between relative abundance (%) of specific OTU and genus and clinical parameters were performed by using Spearman’s correlation analyses. n=10, in each group. (*) represents the specific OTU and genus whose abundance were significantly correlated with certain clinical parameters. The color of the spots in the right panel represents R-value of Spearman’s correlation between the OTU and genus and clinical parameters. OTU, operational taxonomic unit; BW, body weight; BMI, body mass index; BMI1, BMI at the beginning of 1st trimester; BMI2, body mass index at the end of 3rd trimester; BW1, body weight at the beginning of 1st trimester; BW2, body weight at the end of 3rd trimester; IGF-1, insulin-like growth factor-1.

