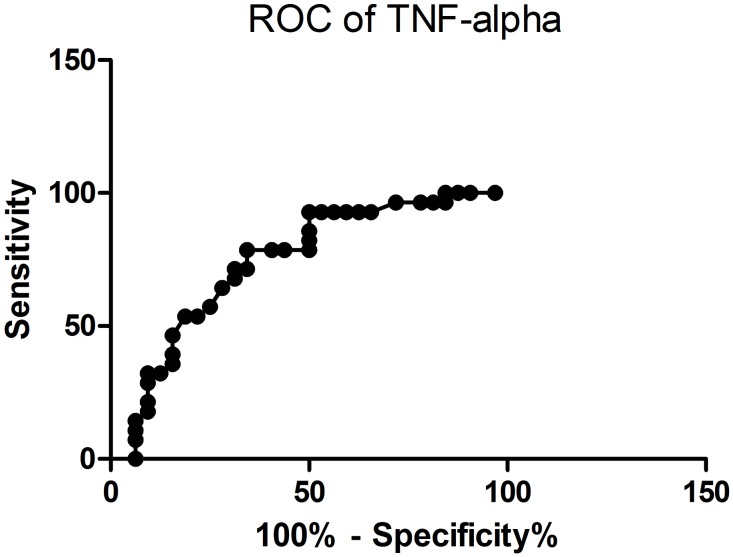
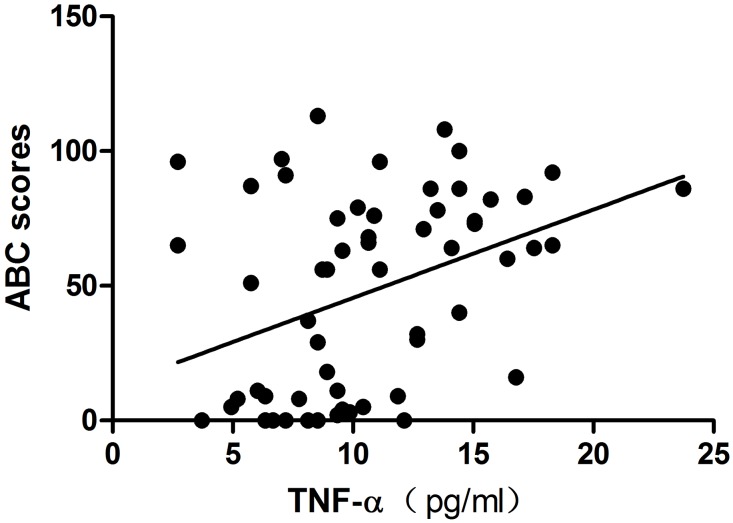
Figure 1.
(A) Area under the curve (AUC) plot for prediction sensitivity of blood TNF-α concentrations (pg/ml) and ASD vs TD classification (AUC = 0.7411; p<0.01). (B) Regression plot showing significant a positive correlation between TNF-α concentrations (pg/ml) and total Autism Behavior Checklist (ABC) scores (r=0.39; p=0.002).


