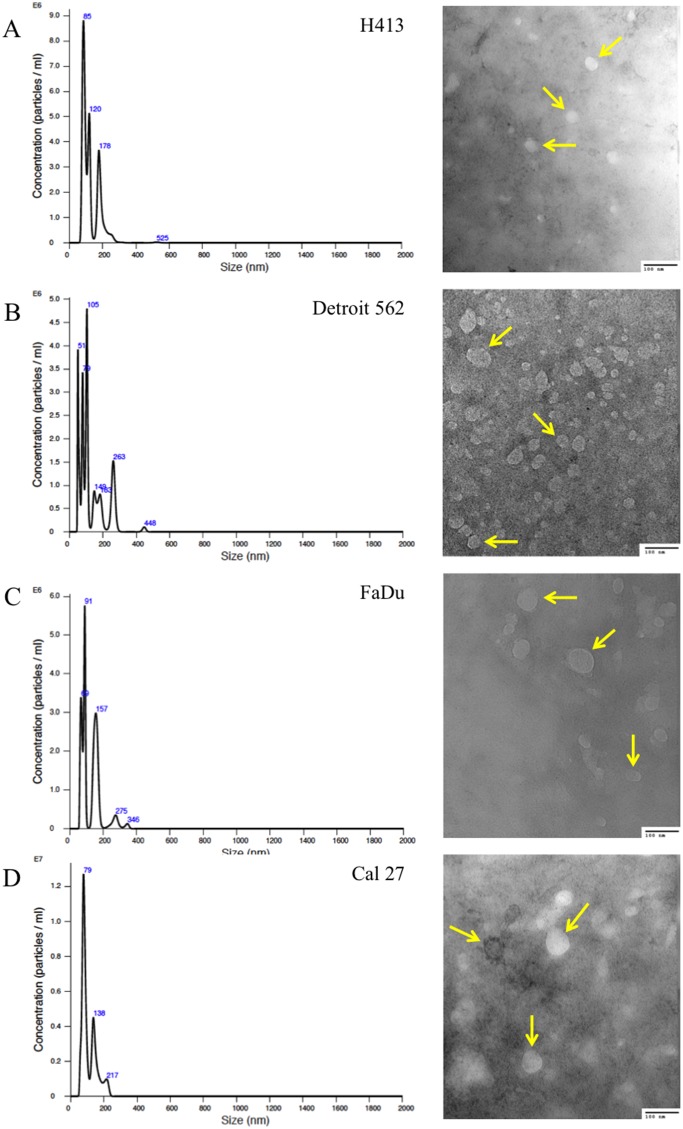
Figure 1. Size distribution plots from nanoparticle tracking analysis of exosome isolates from culture media of head and neck squamous cell carcinoma (HNSCC) cell lines.
(A) H413, (B) Detroit 562, (C) FaDu, and (D) Cal 27, according to particle diameter. Representative transmission electron microscopy (TEM; 200,000x) images of exosomes isolated from each respective HNSCC line are presented to the right of each plot; arrows highlight representative exosomes. A 100-nm scale bar is provided in the bottom right hand corner of each image for perspective.

