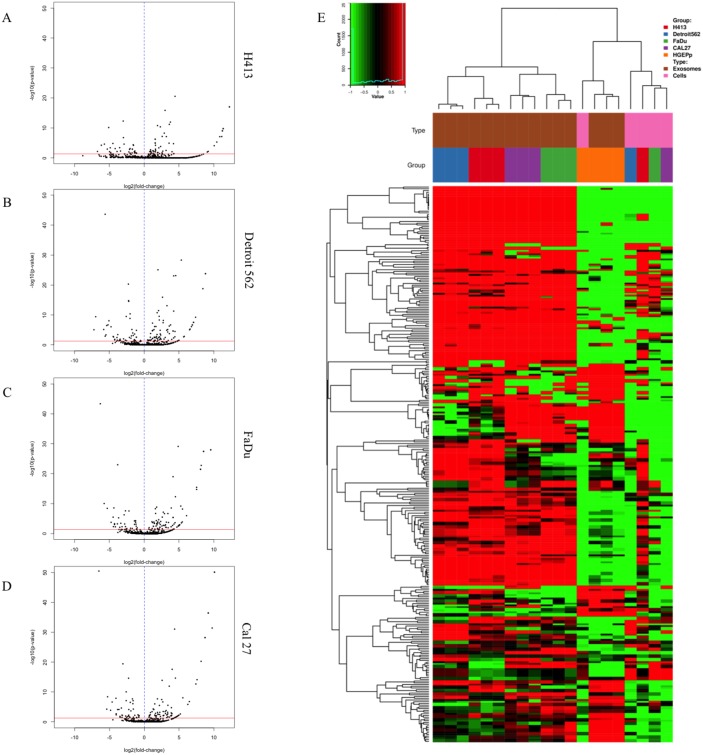
Figure 3. Secretion patterns of exosomal miRNA for head and neck squamous cell carcinoma (HNSCC) cell lines and primary non-pathologic oral epithelial control cells.
Volcano plots for differentially secreted miRNA in exosomes isolated from conditioned cell culture media are depicted for (A) H413, (B) Detroit 562, (C) FaDu, and (D) Cal 27 head and HNSCC cells relative to non-pathologic oral epithelial control cells. The horizontal red line in each plot corresponds to p = 0.05, adjusted for false discovery rate (FDR). Each black dot represents a specific miRNA transcript; those to the right of the vertical blue dashed line correspond to a relative increase in secreted level by the HNSCC cells and those to the left correspond to a relative decrease in secreted level. (E) Heatmap of miRNA profile of exosomes (each in triplicate) or intracellular expression for each HNSCC cell line or non-pathologic oral epithelial control cells. Each column represents a different sample and rows represent miRNA transcripts. Source (exosomal or intracellular) and cell type correspond to the key at the top right of the figure.

