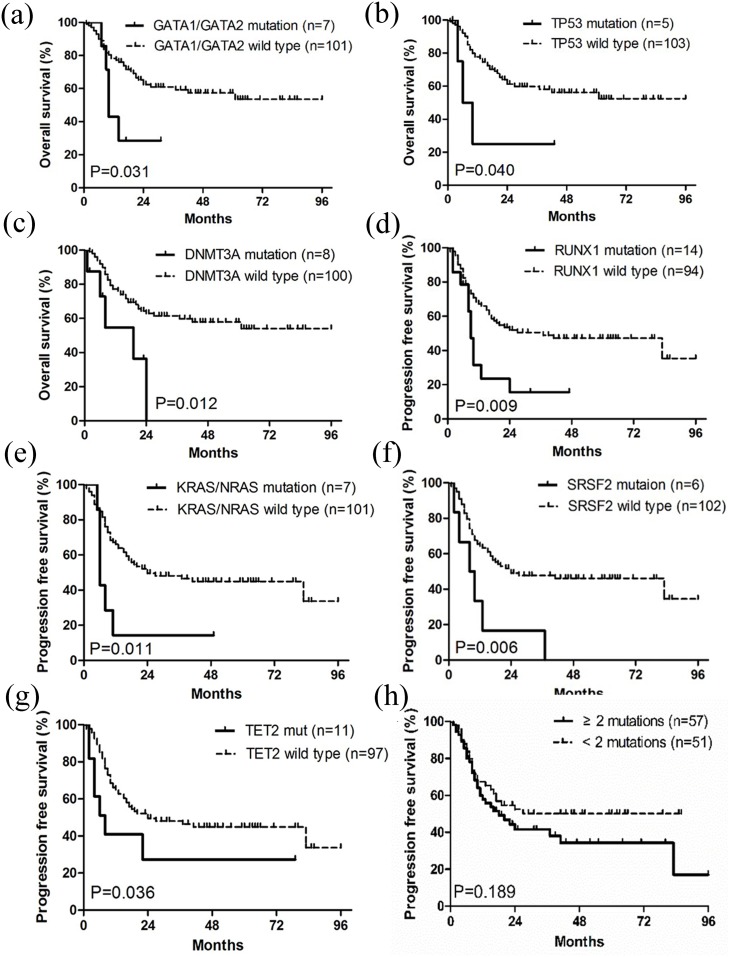
Figure 4. Kaplan-Meier curves of overall survival (OS) and progression free survival PFS.
(a-c) Patients with GATA1/GATA2, TP53 and DNMT3A mutations had worse OS than wild type groups. (d-g) Patients with RUNX1, KRAS/NRAS, SRSF2 and TET2 mutations had worse PFS than wild type groups. (h) Patients with ≥ 2 mutations tended to have shorter PFS than those with < 2 mutations. OS and PFS were stratified by univariate prognostic factors. P values were calculated using the log-rank test.

