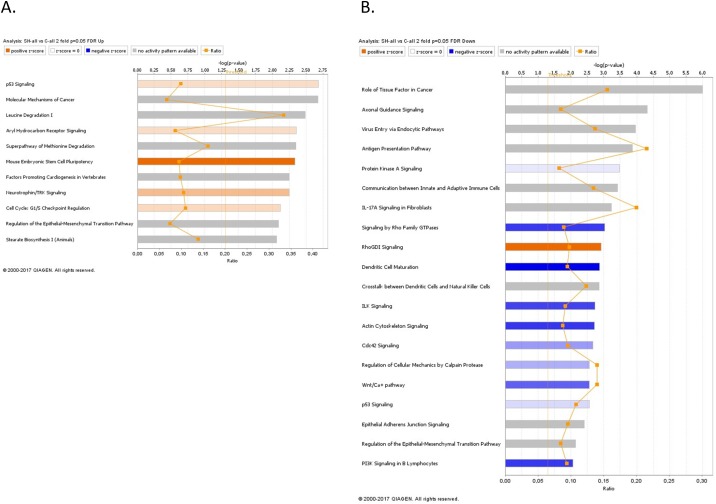
Figure 8. Canonical pathway analysis for a dataset of differentially expressed genes (≥ 2-fold) following Hic-5 suppression in SKOV3 cells.
(A) Canonical analysis of upregulated genes; (B) Canonical analysis of downregulated genes. Top functions that meet a Bonferroni-Holm multiple testing correction p-value of 0.05 are displayed.

