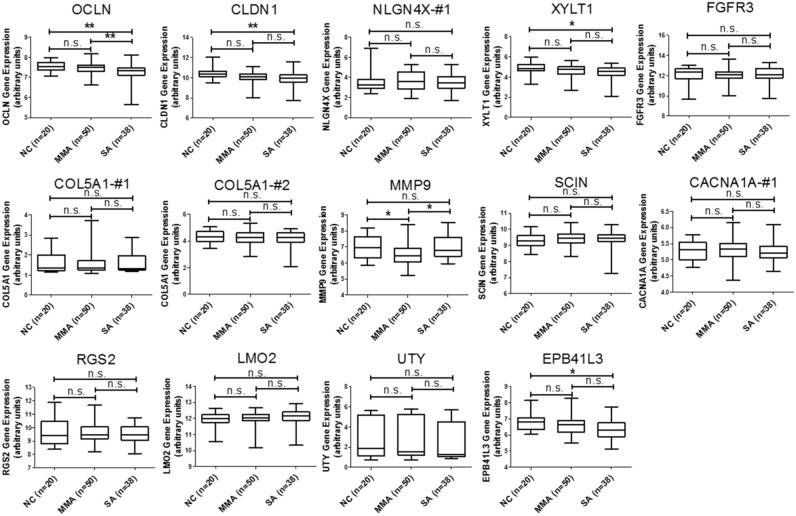
Figure 3. GEO database analysis of upregulated genes identified from KEGG pathway analysis.
Gene expressions of the 13 upregulated genes shown in Table 5 were analyzed using GSE43696 microarray data from the GEO database. None of these 13 genes were significantly upregulated in patients with asthma. n.s. means no significance, * represents p-value < 0.05, ** represents p-value < 0.01, and *** represents p-value < 0.001. (Probe information of GSE43696 array from GEO database: OCLN, A_23_P92672; CLDN1, A_23_P57784; NLGN4X-#1, A_23_P364592; XYLT1, A_24_P787897; FGFR3, A_23_P500501; COL5A1-#1, A_23_P158593; COL5A1-#2, A_23_P83818; MMP9, A_23_P40174; SCIN, A_23_P157136; CACNA1A-#1, A_24_P130559; RGS2, A_23_P114947; LMO2, A_23_P53126; UTY, A_23_P329835; EPB41L3, A_23_P4536.)

