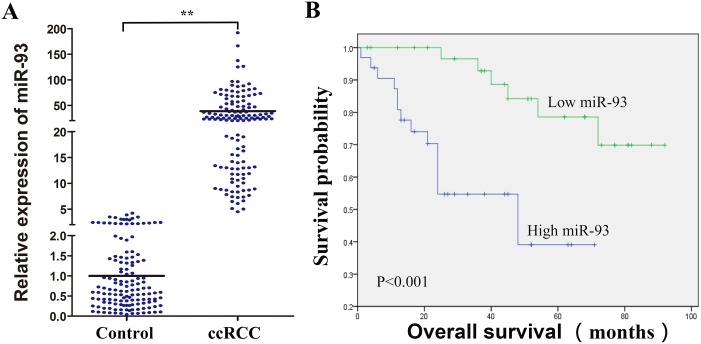
Figure 1. Clinical significance of miR-93-3p in ccRCC patients.
miR-93-3p expression was calculated using the comparative Ct method. Relative expression intensity values were calculated as 2-∆∆Ct. miR-93-3p expression in 138 FFPE normal and ccRCC specimens (A). Control refers to normal kidney tissues, and miR-93-3p levels were normalized to controls. Correlation of miR-93-3p expression with ccRCC patient overall survival (B). “NC”, “miR” and “anti-miR” represented negative control, miR-93-3p and miR-93-3p inhibitor respectively. **P<0.001.

