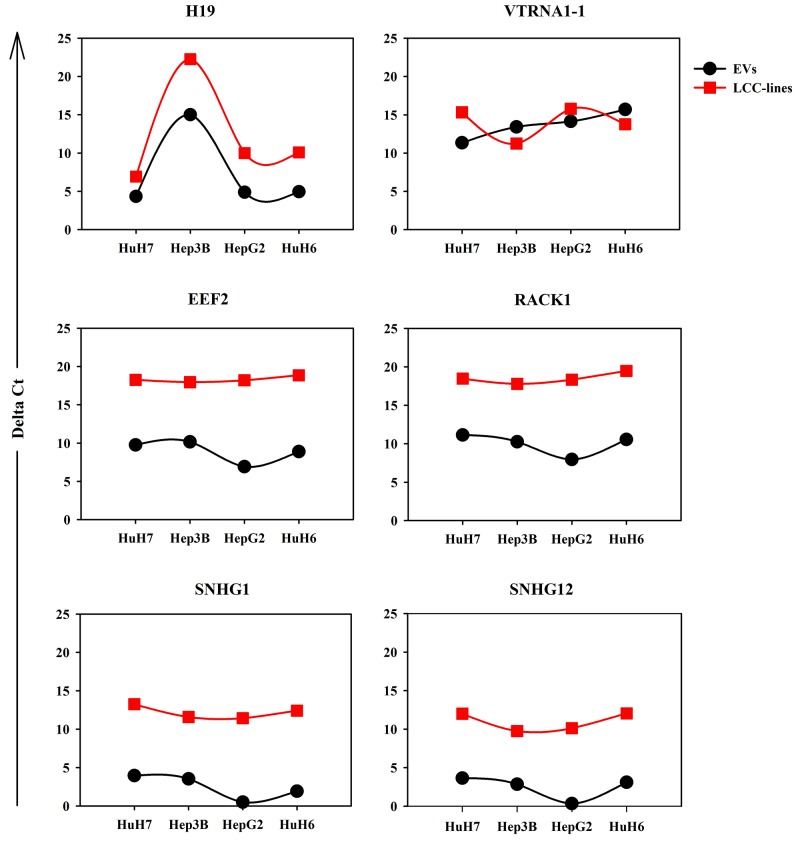
Figure 3. RT-qPCR analysis of the expression levels in LCC-EVs and LCC-lines of the following 6 transcript: H19, VTRNA1-1, EEF2, RACK1, SNHG1, SNHG12.
Each panel shows two dot plots reporting the expression data in LCC-EVs and LCC-lines relative to the indicated RNA transcript. Black series: LCC-EVs; red series; LCC-lines. Data are from biological duplicates and each measurement was performed in triplicate. Standard error bars are comprised within the area of the square and round symbols.

