
Figure 1.
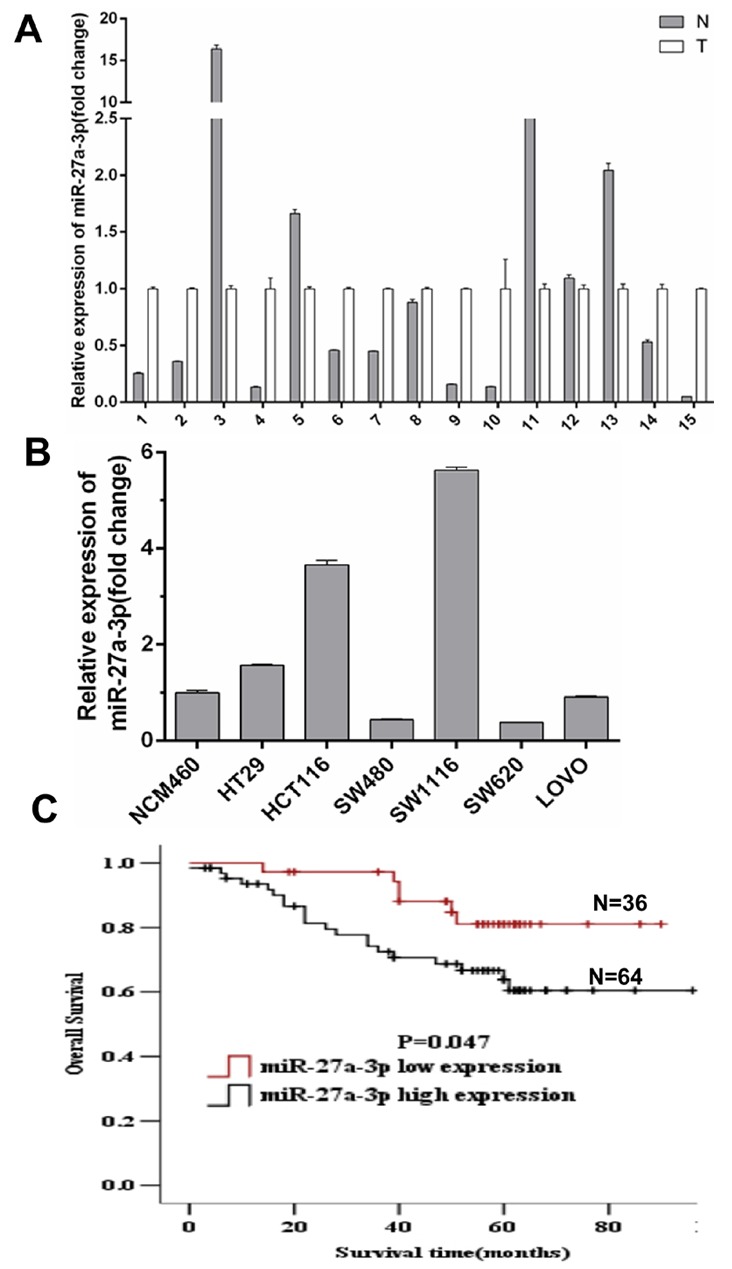
(A) miR-27a-3p expression level in 15 paired of fresh CRC samples (T) and adjacent non-tumor colorectal mucosa tissues (N) by quantitative real-time PCR analysis. (B) miR-27a-3p expression level in CRC cell lines. Data were normalized against the miR-27a-3p expression level in NCM460 cells. (C) Overall survival of CRC patients with different levels of miR-27a-3p expression by Kaplan-Meier analysis.