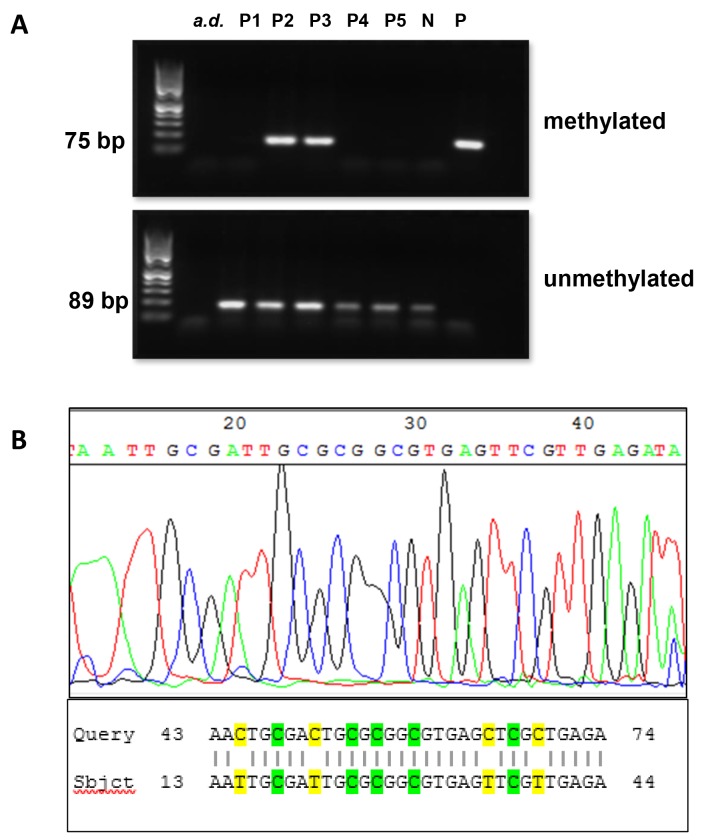
Figure 1. Analysis of BRCA1 promoter methylation status by MS-PCR and sanger sequencing.
(A) Methylation status of representative patient samples (P1-P5) determined by MS-PCR. Signals in the upper panel represent the presence of methylated DNA, whereas signals in the lower panel represent the presence of unmethylated DNA. MS-PCR controls: water (a.d.), genomic DNA from MDA-MB-231 cell line as negative control (N), universal methylated standard DNA as positive control (P). Patients 2 and 3 (P2/P3) showed BRCA1 hypermethylation, whereas, BRCA1 promotor in patients P1, P4 and P5 was unmethylated. Signals for unmethylated DNA were always seen as the tumor tissue samples always contained a small amount of normal cell. (B) Exemplary sequencing electropherogram of BRCA1 reverse primer amplicon (upper panel). There are four hypermethylated CpG sites shown at position 18-19, 24-25, 26-27, 29-30, and 37-38 noticeable by the conservation of cytosine within the CpG site. The product of the Sanger sequencing compared to the primary sequence of the BRCA1 promoter in BLAST (Basic Local Alignment Search Tool) (www.ncbi.nlm.nih.gov/BLAST) (lower panel). The conserved cytosines within the CpG sides are highlighted green at subject position 18, 24, 26, 29 and 37. The yellow marked bases at subject position 15, 21, 35 and 39 are former cytosines transformed into uracils and detected as thymine due to the bisulfite treatment.

