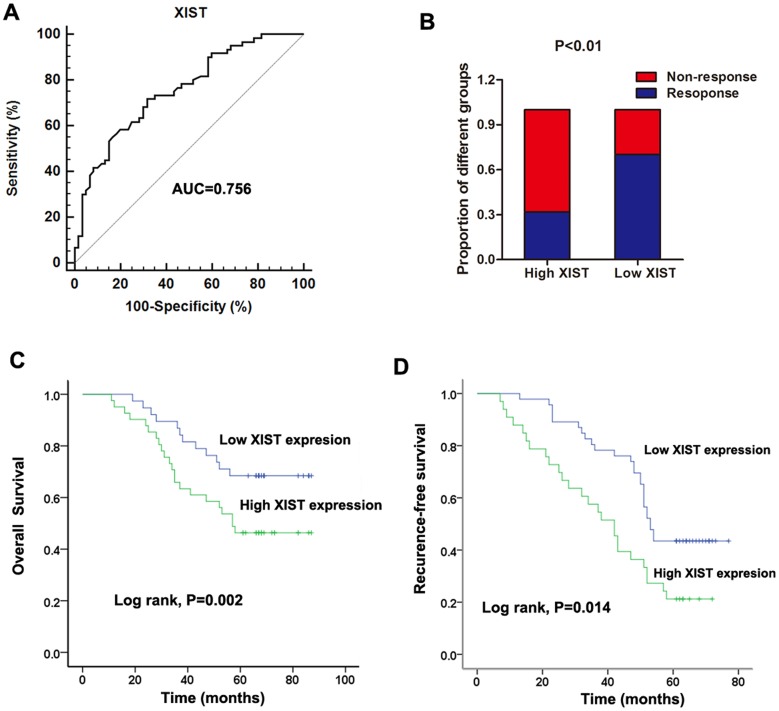
Figure 3. Increased serum XIST expression was associated with poor response to 5FU treatment in CRC patients.
(A) ROC curves for differentiating the responding patients from non-responding patients of CRC using XIST expression in validation cohort. (B) The proportion of patients that responded to 5FU treatment was significantly lower in the high XIST expressing group than in the low expressing group. (C-D) Kaplan-Meier curves for OS (C) and RFS (D) according to serum levels of XIST in CRC patients in validation cohort.

