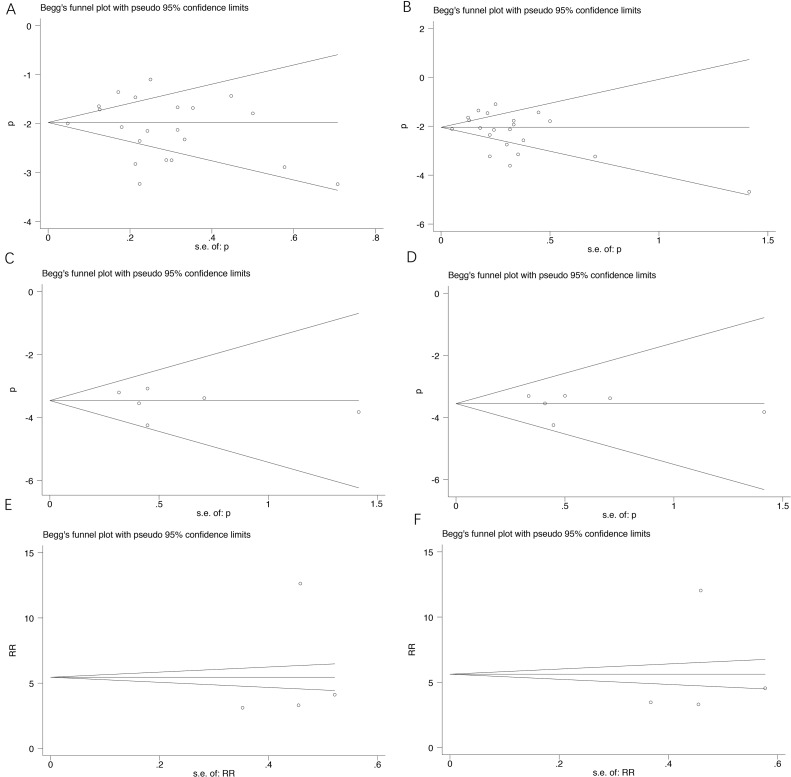
Figure 5. Funnel plot for studies included in the meta-analysis.
Each study was shown by the name of the lead author and year of publication. The summary incidences were also shown in the figure. Plots are arranged as follows: (A) Sensitivity analysis of studies of incidence of all-grade cuSCC of BRAF inhibitor; (B) Sensitivity analysis of studies of incidence of high-grade cuSCC of BRAF inhibitor; (C) Sensitivity analysis of studies of incidence of all-grade cuSCC of dual BRAF/MEK inhibitors; (D) Sensitivity analysis of studies of incidence of high-grade cuSCC of dual BRAF/MEK inhibitors; (E) Sensitivity analysis of studies of RR of all-grade cuSCC; (F) Sensitivity analysis of studies of high-grade cuSCC.

