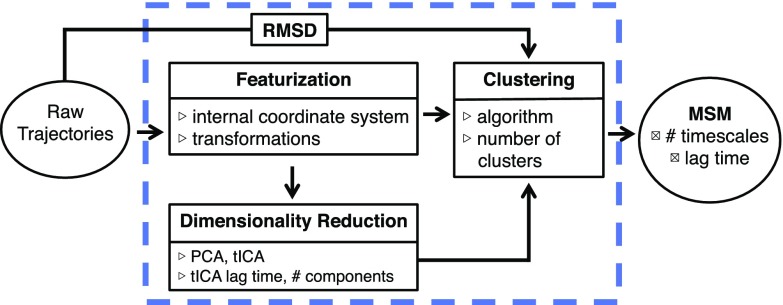
FIG. 1.
The flow chart shows several ways to create a MSM from raw simulation data. The blue box indicates which of the parameters enumerated can be optimized using the GMRQ. The MSM lag time and number of timescales scored must be held constant. This figure is adapted with permission from Husic et al., J. Chem. Phys. 145, 194103 (2016). Copyright 2016 AIP Publishing LLC.

