
Fig. 1.
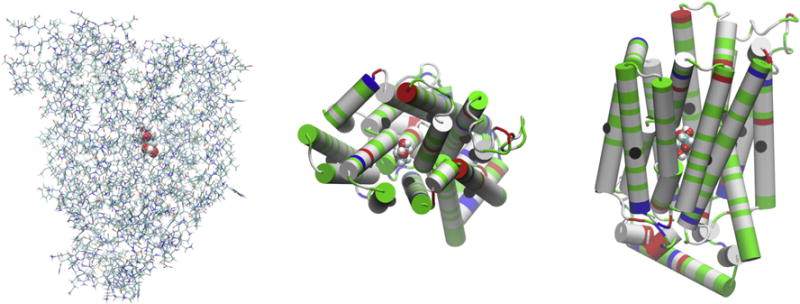
The XylE-XYP complex. The coordinates are from the last frame of 50 ns MD run of the all-atom model system. In the left panel is the side view of the complex where the protein is represented in licorices and the sugar in large spheres all colored by atoms (H, white; C, cyan; O, red; N, blue; S, yellow). The top side is the extracellular side. The central panel gives the top view and the right panel gives the side view of the complex where the protein is represented in cartoons colored by residue types (polar, green; hydrophobic, white; positively charged, blue; negatively charged, red). The 12 Cα atoms on the 12 transmembrane helices (Leu23Cα, Leu65 Cα, Phe95Cα, Gly136Cα, Ile172Cα, Pro209Cα, Gln289Cα, Leu326Cα, Gly351Cα, Phe383Cα, Ala418Cα, Cys450Cα) are shown as large black spheres in the central and the right panels. All molecular graphics were rendered with VMD[28].