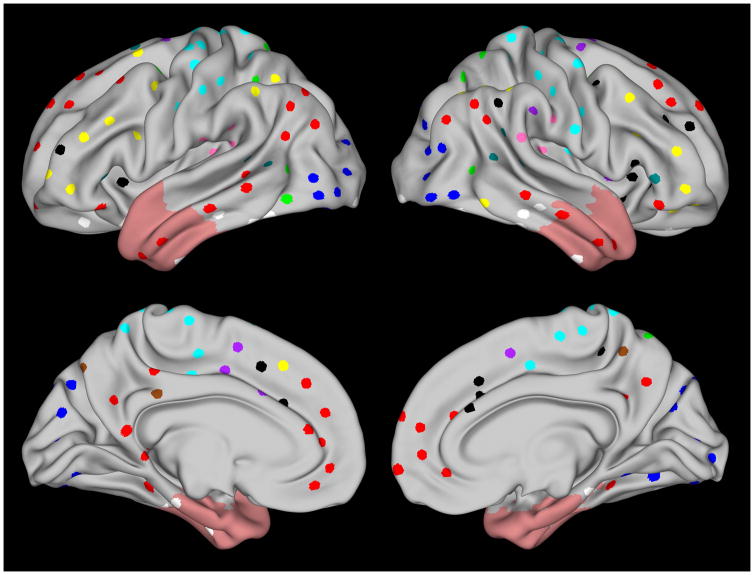
Figure 1.
Regions of interest studied are shown projected onto the Human Connectome Project 440-subject (R440) group-average mid-thickness surface for each hemisphere39; 40. Functional subnetworks are color-coded and include sensory/somatomotor (cyan), visual (blue), auditory (pink), default mode (red), cingulo-opercular task control (purple), fronto-parietal task control (yellow), salience (black), memory retrieval (brown), ventral attention (teal), dorsal attention (green) and uncertain classification (white). Light red shading shows the extent of the mask used to exclude nodes within or immediately near surgically resected areas across patients.

