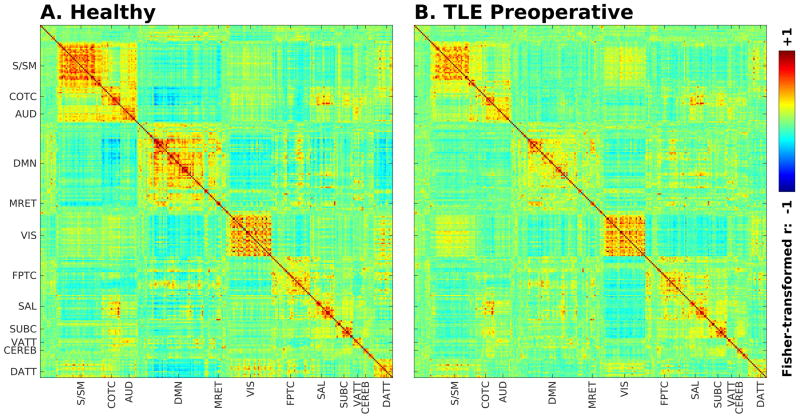
Figure 2.
Seed-seed group functional connectivity matrices for healthy controls (A) and preoperative TLE patients (B). Connectivity strength is displayed as Fisher-transformed Pearson’s r (with color scale arbitrarily bounded between −1 and +1). Axis labels denote approximate distribution of functional cognitive subnetworks (S/SM – sensory/somato-motor, COTC – cingulo-opercular task control, AUD – auditory, DMN – default mode, MRET – memory retrieval, VIS – visual, FPTC – fronto-parietal task control, SAL – salience, SUBC – subcortical, VATT – ventral attention, CEREB – cerebellar, DATT – dorsal attention).

