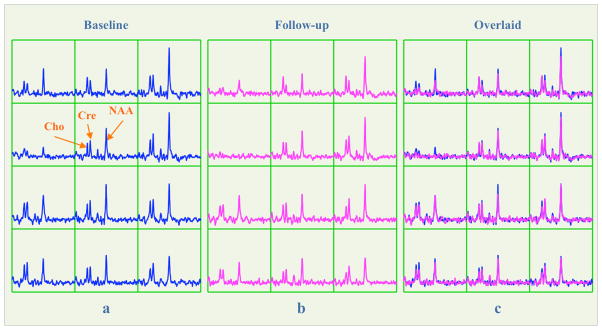
Figure 3.
(a) and (b) The baseline and follow-up spectra in the green grid on the coronal slices in Figure 2(b) and (c), respectively. (c) Overlay of the follow-up spectra on the top of the baseline ones. Note all spectra were displayed with the same intensity range, but the SNR and line width of Cre were similar between the two scans (Baseline/follow-up SNR: 13.4/12.2; Baseline/follow-up line width: 6.8/6.6Hz).

