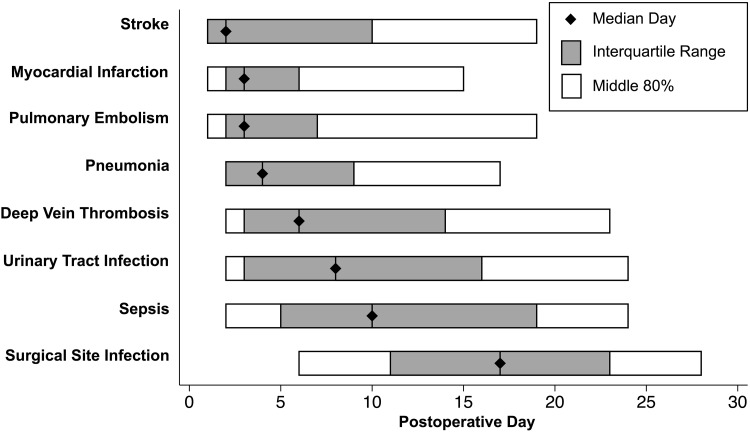
Fig. 1.
This figure displays the summary statistics for the timing of adverse events. The median day of diagnosis (and interquartile range; middle 80%) for stroke was 2 (1–10; 1–19), myocardial infarction 3 (2–6; 1–15), pulmonary embolism 3 (2–7; 1–19), pneumonia 4 (2–9; 2–17), deep vein thrombosis 6 (3–14; 2–23), urinary tract infection 8 (3–16; 2–24), sepsis 10 (5–19; 2–24), and surgical site infection 17 (11–23; 6–28).

