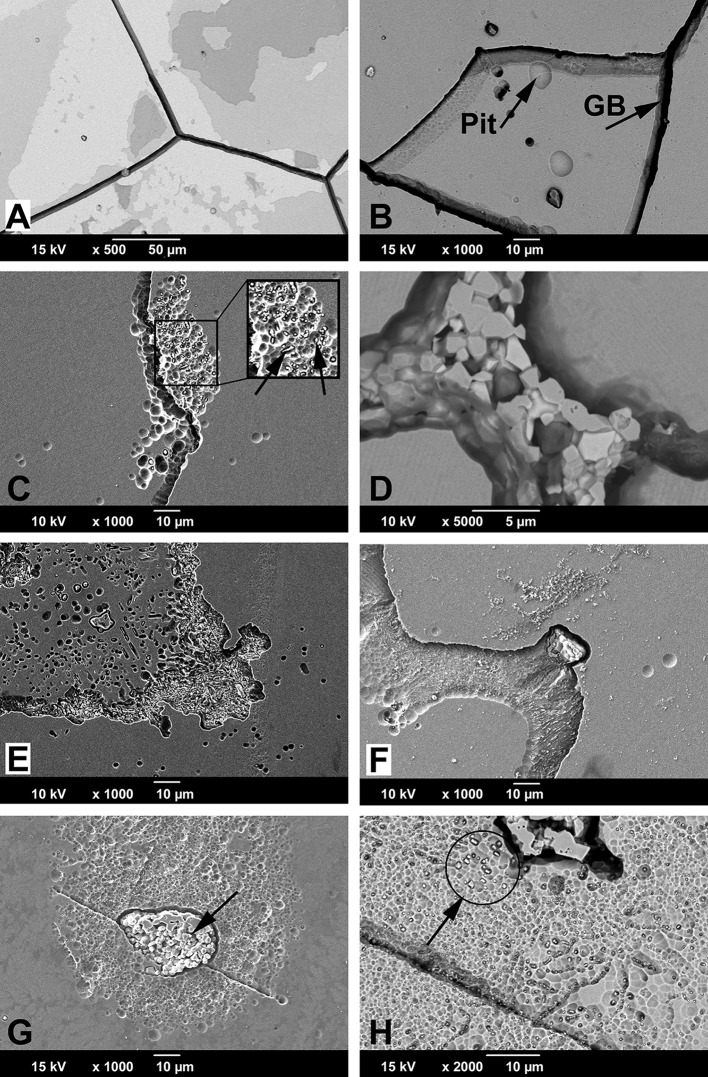
Fig. 5A–H.
SEM of damage features on cast alloy samples: (A, B) SA-1; (C–F) SA-2; and (G–H) SA-3. (A, B) SEM images of damage features of cast alloy SA-1 samples. SA-1 did not have hard phases. (A) Imaging with BSE mode revealed chromium oxide films on the surface along with grain boundary corrosion. Oxide films are visible because elements with low atomic numbers appear darker in BSE images. The actual alloy surface is the brightest area in the figure. Different shades of gray mark areas with oxide films that are thicker (> 0.5 µm) than the usual passive film (< 10 nm). Darker areas indicate thicker oxide films. (B) SA-1 sample with corrosion along the grain boundaries (GB) and a few random pits. (C) SA-2 sample showing pitting corrosion along grain boundaries in the presence of very fine hard phases (arrows). (D) BSE image of mixed hard phase along the grain boundary of a SA-2 sample: white phase (high atomic number) was rich in Mo and Si, gray phase exhibited mainly Co and Cr, and dark phases appeared to be carbides based on carbon content (low atomic number). (E) SA-2 sample showing small elongated and round pits that resulted from phase boundary corrosion and subsequent hard phase detachment. (F) SA-2 sample showing large shallow pit along a grain boundary that resulted from phase boundary corrosion and hard phase detachment. (G) SA-3 samples showing severe pitting around coarse hard phases. (H) SA-3 samples often exhibited fine hard phase clusters around coarse hard phases within grains that were associated with severe pitting. Fine hard phases appear bright using the BSE mode (arrow).

