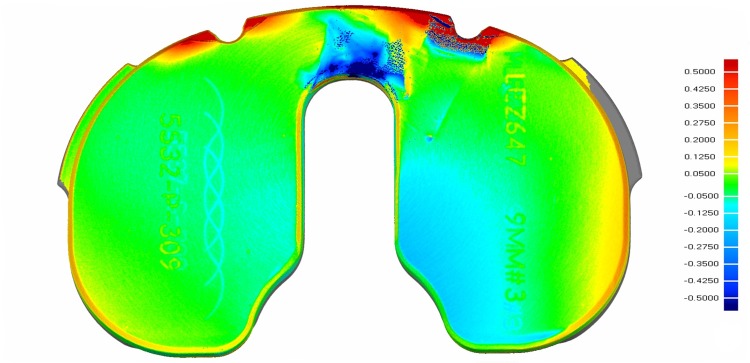
Fig. 2.
An example of a deviation map for linear wear rate (mm/year) for one of the backsurfaces of a retrieved Triathlon polyethylene insert generated from micro-CT scanning is shown. The color bar on the right indicates linear wear in mm per year. Positive wear rates correlate with cold flow. Damage from extraction can be seen along the anterior edge of the retrieved polyethylene that was not analyzed.

