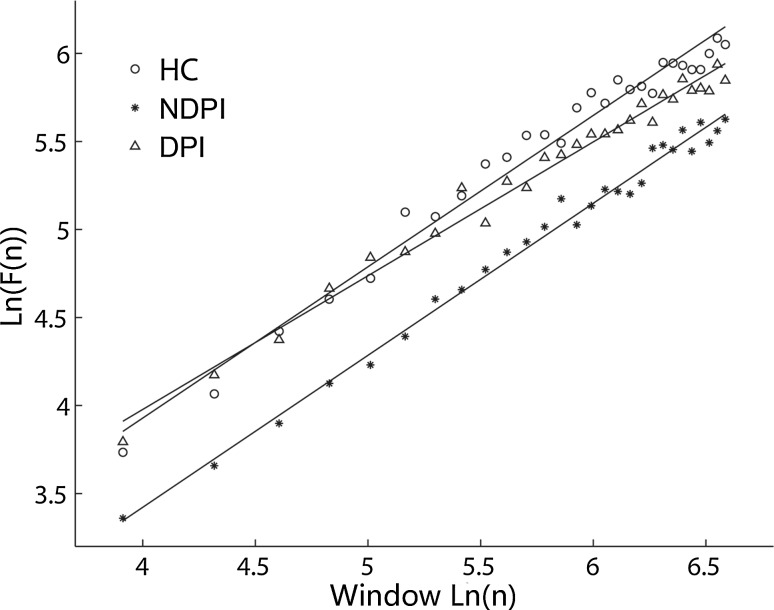
Fig. 1.
An example of the linear relationship in a double logarithmic plot in the range of 0.2–3 s between the magnitude of fluctuation F(n) and n for the FP1 channel in three subjects from depression post-infarction (DPI) and non-depression post-infarction (NDPI) with right hemispheric lesion and healthy control (HC). The scaling exponents of the three subjects were 0.760 (DPI), 0.863 (NDPI) and 0.860 (HC)

