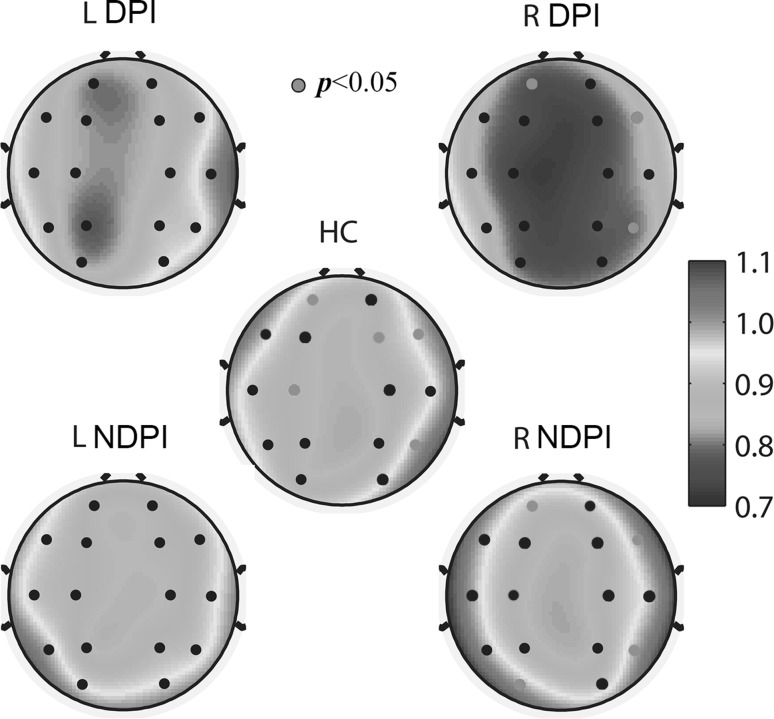
Fig. 2.
Topographic plots of the scaling exponents of broadband oscillations in depression post-infarction (DPI) and non-depression post-infarction (NDPI) subjects with left and right hemispheric lesions and healthy control (HC) subjects. The pink colour of electrode locations of HC and NDPI with right hemispheric lesions represents p values of the t test compared to DPI less than 0.05. The pink colour of electrode locations of DPI indicates the channel in which both p values of the t-test with HC and NDPI were less than 0.05. (Color figure online)

