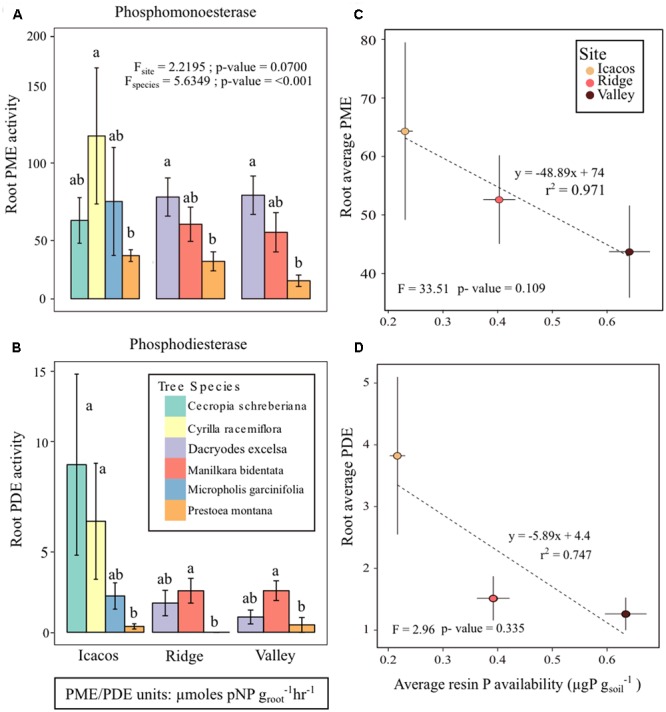
FIGURE 2.

(A) Root phosphomonoesterase (PME) activity, (B) root phosphodiesterase (PDE) activity, (C) average root PME activity plotted with average resin P availability at each site, and (D) average root PDE activity with average resin P availability. Letters represent differences in group means among tree species and error bars are mean ± SE with n = 3 individual trees per species at each site.
