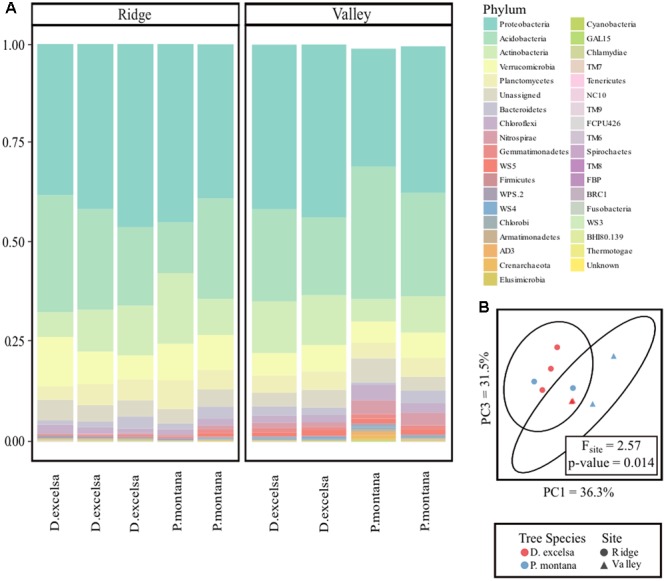
FIGURE 3.

Comparison of bacterial communities between Ridge and Valley sites and D. excelsa and P. montana. Relative abundance plot of bacterial phyla > 2% of the community (A). One P. montana sample in the Valley contained multiple phyla each representing < 2% of the community. These were excluded from the plot resulting in a shorter bar. PCoA with ellipsoids representing 95% confidence intervals (B).
