Figure 1.
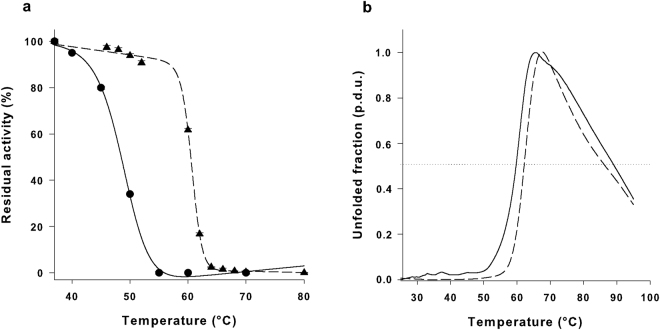
Thermal stability assays. (a) EcAII WT (circle) and N24S (triangle) thermal inactivation plot. Results are reported as residual activity percentage of heat-treated vs. untreated sample. Samples were incubated at 37 °C for 10 min and the residual activity was measured in the presence of 10 mM L-Asn. (b) Heat-induced melting curves of WT (continuous line) and N24S EcAII (dashed line). The horizontal dotted line is the reference line corresponding to an unfolded fraction value equal to 0.5. Melting curves were obtained by thermal shift analysis using CYPRO orange as a fluorescent dye. Unfolded fraction values are reported as procedure defined units (p.d.u.).

