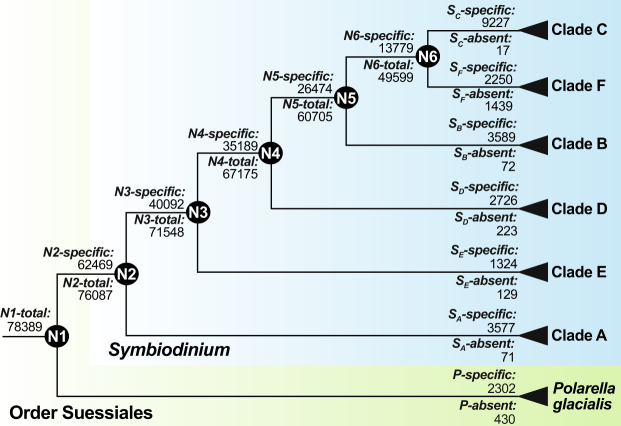
Figure 3.
Changes in gene family numbers in Suessiales shown for Symbiodinium phylogeny (simplified cladogram based on Pochon et al.37), with Polarella glacialis as outgroup. The notation in this diagram is used throughout the text. Numbers of total and specific gene families at each node are shown to the left of the node in question. Numbers of specific and absent gene families for each lineage are correspondingly shown at the tips (right).

