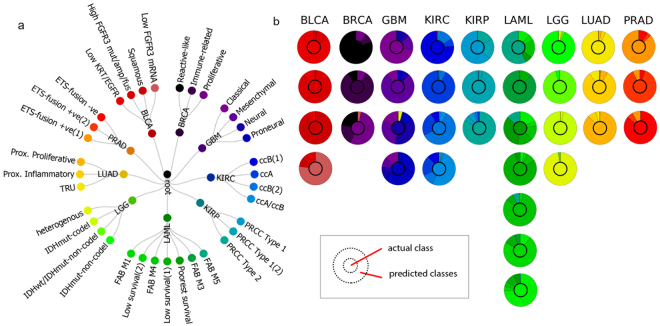
Figure 2.
Cancer genomic dataset hierarchical classification. (a) Hierarchical tree structure for the cancer dataset analyzed derived from previous literature, where cancer types (level 1) were classified with a mean accuracy of 99% while subtypes (level 2) were classified with a mean accuracy of 76 ± 2%; (a) Semi-quantitative plot showing the classification performance at the bottom-most level/cancer sub-type level, as well as where misclassifications occurred. The inner circle indicates the actual class while outer circle indicates the predicted class. Columns represent the different cancer types while rows represent corresponding sub-types. Sub-type colors correspond with the node colors assigned in the lower-most layer of the hierarchical tree (a).

