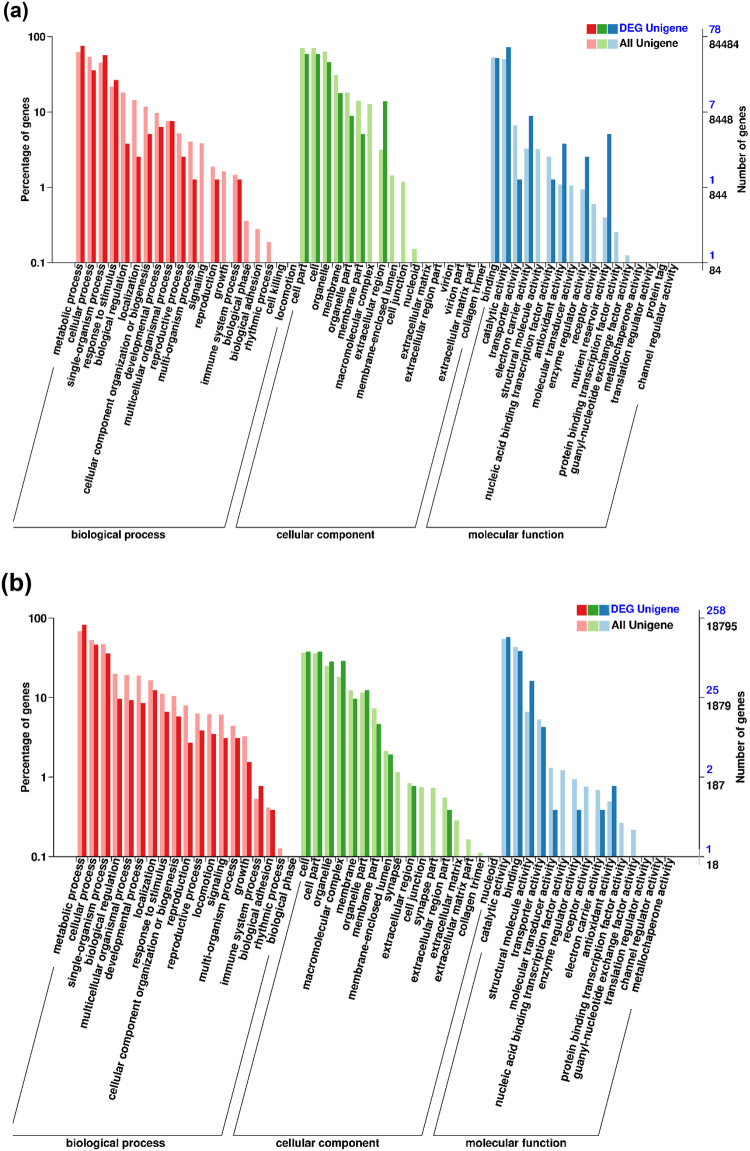
Figure 3.
Gene Ontology (GO) categories of all unigenes and differentially expressed unigenes (DEG unigenes) in the wheat roots (a) and Heterodera avenae juveniles (b) in the study. The number and percentage of genes in each subcategory for the three main categories of biological process, cellular component, and molecular function are indicated for all the unigenes and DEG unigenes, respectively. On the right y-axis, blue and black numbers are DEG unigenes and all unigenes, respectively.

