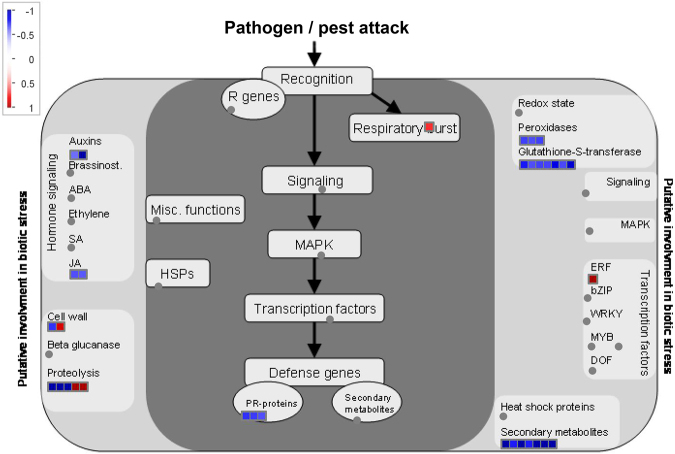
Figure 6.
Visualization of biotic stress pathways in wheat differentially expressed genes (DEGs) by MapMan. Thirty-three data points showing putative involvement in biotic stress were mapped for 29 DEGs of wheat (see detailed information on the genes in Supplementary Table S6). Red and blue dots represent the genes that were up- and down-regulated in wheat roots when they were exposed to nematodes compared to the control (wheat roots without contact with the juvenile nematodes), respectively. The magnitude of the change in gene expression is associated with deepness of the colour.

