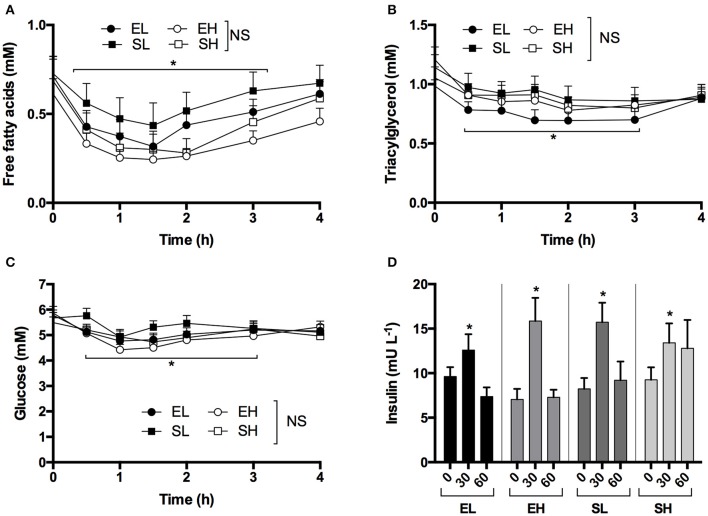
Figure 2.
Concentrations of plasma non-esterified fatty acids, triacylglycerol, glucose, and insulin following equimolar ketone ester and ketone salt drinks, at two amounts, in subjects (n = 15) at rest. Values are means ± SEM. (A) Plasma FFA. (B) Plasma TG. (C) Plasma glucose. (D) Plasma insulin at baseline and after 30 and 60 min. EH, ketone ester high; EL, ketone ester low; SH, ketone salt high; SL, ketone salt low. *p < 0.05 difference from baseline value.

