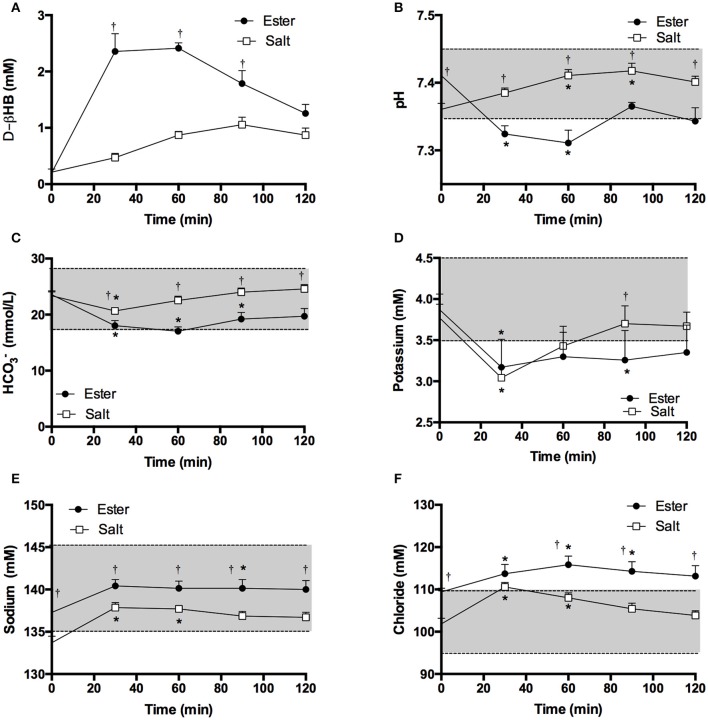
Figure 3.
Blood d-βHB, pH, bicarbonate () and electrolytes measured in arterialized blood samples from resting subjects (n = 7) following a ketone ester or salt drink containing 3.2 mmol.kg−1 of βHB. Shaded areas represent the normal range. Values are means ± SEM. (A) Venous blood d-βHB. (B) Arterialized blood pH. (C) Blood bicarbonate. (D) Blood potassium. (E) Blood sodium. (F) Blood chloride. †p < 0.05 difference between KE and KS, *p < 0.05 difference from baseline value.

