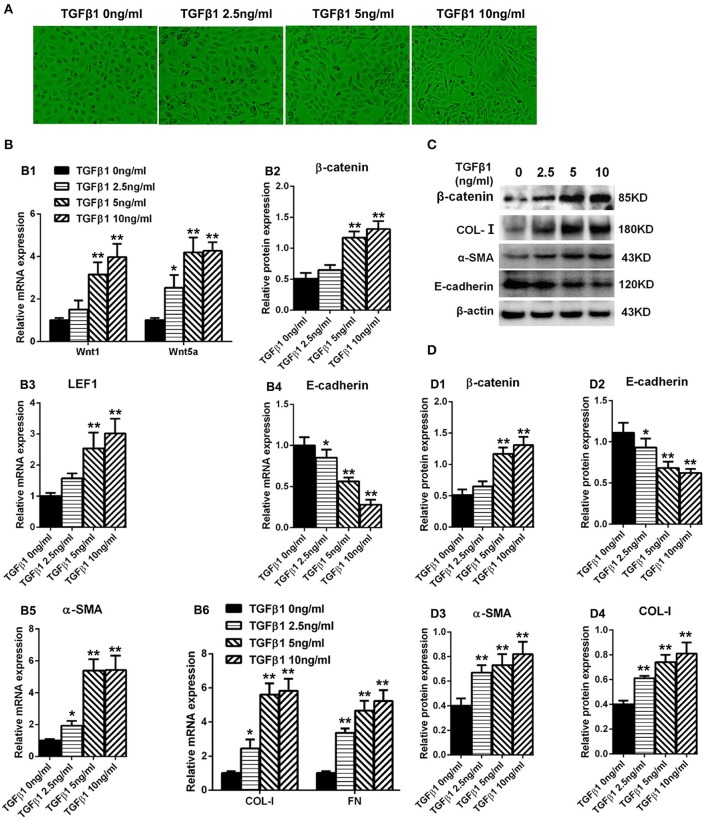
Figure 5.
Expression of Wnt1, Wnt5a, β-catenin, LEF1, and epithelial-mesenchymal transition-related genes in HPMCs induced by TGF-β1. (A) The shape transformation of HPMCs with different concentration of TGF-β1 treatment. (B,B1–B6) The relative mRNA level of Wnt1, Wnt5a, β-catenin, LEF1, E-cadherin, α-SMA, COL-I, and FN analyzed by real-time PCR. (C) The protein level of β-catenin, E-cadherin, α-SMA, COL-I analyzed by western blotting. (D,D1–D4) The density of relative bands depicted of β-catenin, E-cadherin, α-SMA, COL-I by western blotting. Values are the mean ± s.e.m., n = 3, **P < 0.01 vs. control (TGF-β10 ng/ml), *P < 0.05 vs. control (TGF-β1 0 ng/ml).

