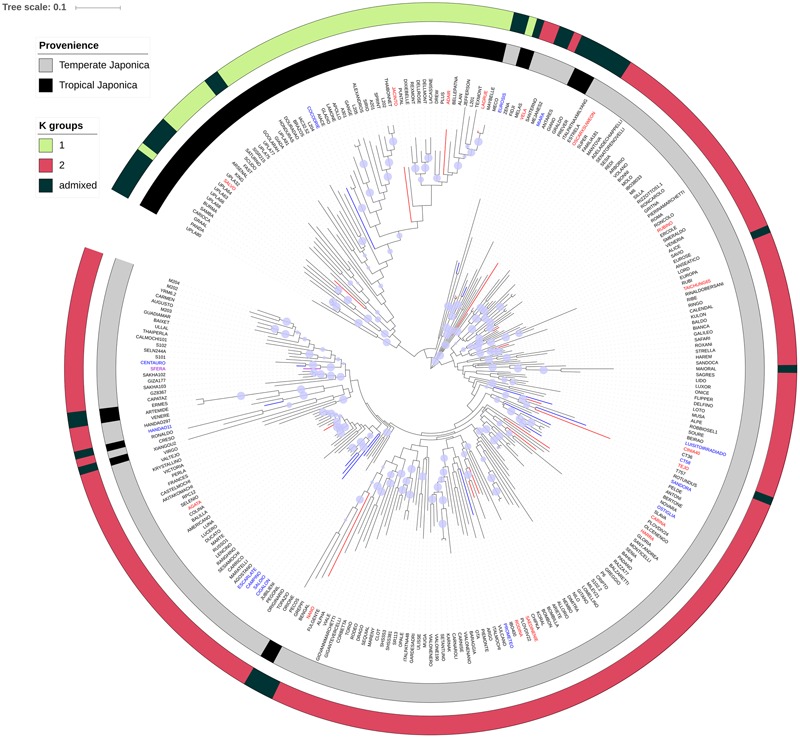
FIGURE 5.

Neighbor-joining tree of the rice panel used in the study. The blue circles on each branch show the results of the bootstrap analysis, when higher than 0.7. The inner gray-and-black coded cycle represents the clustering of the different varieties of the panel according to O. sativa classification; the outer cycle (three-color scaled) reports the cluster organization resulting from the STRUCTURE analysis. The rice accessions showing LW/PF values for the PW, HGW, and both traits above the 95 percentile were, respectively, blue, red, and violet highlighted in the neighbor-joining tree.
