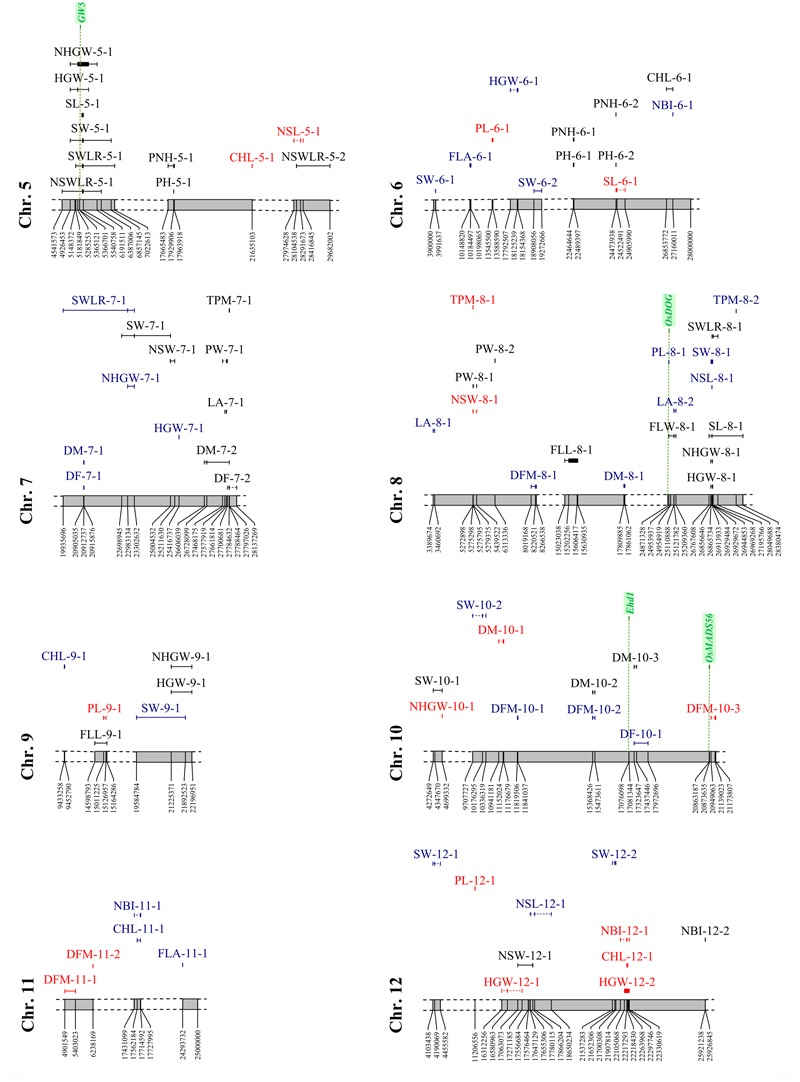
FIGURE 7.

Distribution of the significant associations detected on chromosomes 5 to 12, as indicated in Supplementary Tables S2 and S3 (sheet 1). Acronyms of the traits are as indicated in Table 1. Associations LW-specific, PF-specific and common to both watering treatments are represented in red, blue, and black, respectively. Candidate gene locations are shown as green vertical dashed lines with names on top.
