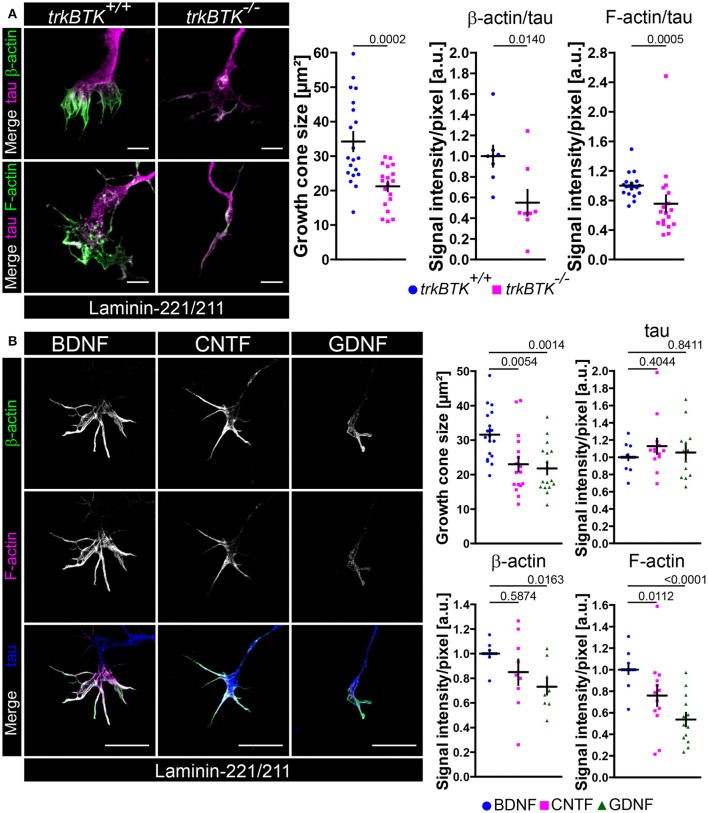
Figure 5.
Actin cytoskeleton deficits in growth cones of trkBTK−/− and BDNF-deprived embryonic motoneurons on laminin-221. (A) Representative images of growth cones of trkBTK+/+ and trkBTK−/− motoneurons cultured on laminin-221/211 for 5 days in vitro and stained against tau (magenta) and either β-actin or F-actin (green) (scale bar: 5 μm). TrkBTK−/− motoneurons developed significantly smaller growth cones (trkBTK+/+ 34.23 ± 2.77 μm2, Q2 29.45 μm2, n = 20, N = 308; trkBTK−/− 21.22 ± 1.41 μm2, Q2 22.81 μm2, n = 19, N = 341; p = 0.0002) with β-actin (trkBTK+/+ 1.00 ± 0.10, Q2 1.00, n = 8, N = 154; trkBTK−/− 0.55 ± 0.12, Q2 0.45, n = 8, N = 167; p = 0.0140) and F-actin (trkBTK+/+ 1.00 ± 0.04, Q2 0.99, IQR 0.15, n = 19, N = 254; trkBTK−/− 0.76 ± 0.11, Q2 0.64, IQR 0.44, n = 18, N = 298; p = 0.0005) deficits in comparison to wild type controls. Tau levels were comparable between both genotypes. (B) Representative images of axonal growth cones of embryonic motoneurons cultured on laminin-221/211 for 5 days in vitro in the presence of BDNF, CNTF or GDNF and stained against β-actin (green), F-actin (magenta) and tau (blue) (scale bar: 5 μm). Growth cones of CNTF- and GDNF-treated motoneurons were significantly reduced in size (BDNF 31.59 ± 1.75 μm2, Q2 31.05 μm2, n = 18, N = 385; CNTF 23.01 ± 2.12 μm2, Q2 20.73 μm2, n = 17, N = 425; GDNF 21.79 ± 1.69 μm2, Q2 18.27 μm2, n = 17, N = 435; p(B-C) = 0.0054, p(B-G) = 0.0014) showing F-actin deficits (BDNF 1.00 ± 0.04, Q2 1.00, IQR 0.01, n = 14, N = 276; CNTF 0.76 ± 0.10, Q2 0.79, IQR 0.33, n = 13, N = 308; GDNF 0.54 ± 0.06, Q2 0.49, IQR 0.37, n = 13, N = 314; p(B-C) = 0.0112, p(B-G) < 0.0001). GDNF-treated growth cones revealed a reduction in β-actin levels. Tau was comparable in each analyzed condition.

