Figure 7.
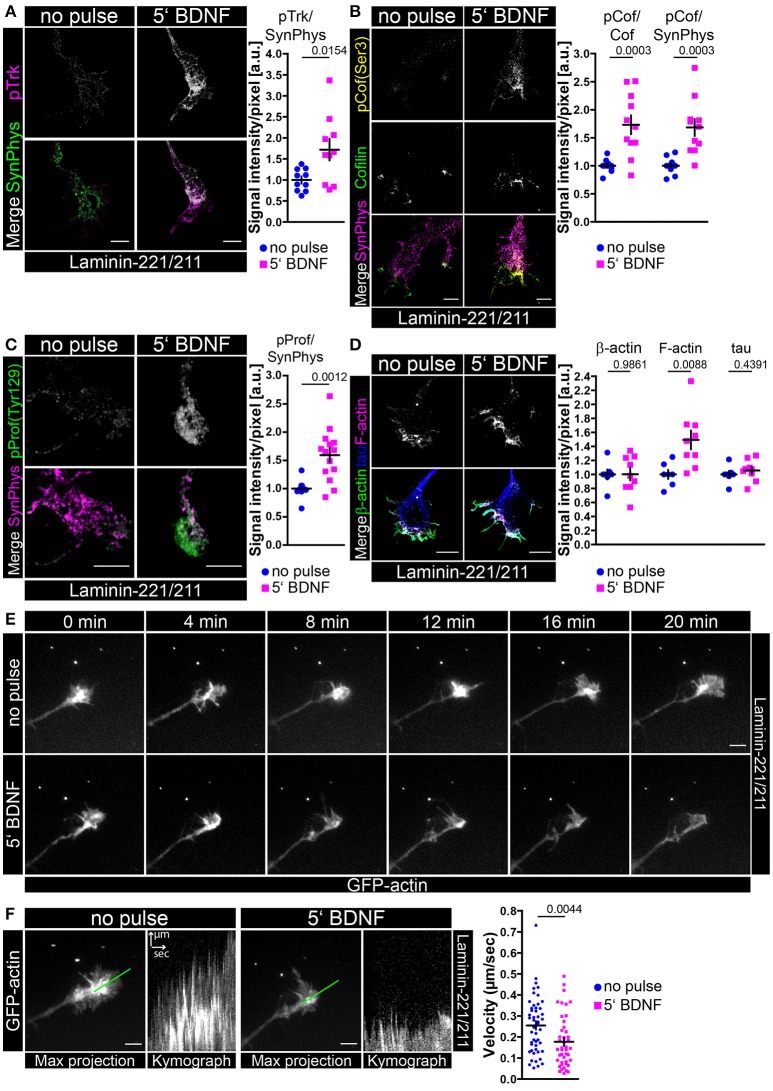
Transient BDNF application on laminin-221 activates trkB signaling pathways in growth cones of motor axons resulting in phosphorylation of cofilin and profilin stabilizing actin. (A) Representative images of axonal growth cones of embryonic motoneurons cultured on laminin-221/211 for 5 days in vitro and stained against phospho-trk (magenta) and synaptophysin (green) (scale bar: 5 μm). Upon BDNF pulse phospho-trk immunoreactivity was significantly increased (no pulse 1.00 ± 0.08, Q2 1.00, n = 10, N = 136; 5′ BDNF 1.72 ± 0.25, Q2 1.63, n = 10, N = 137; p = 0.0154), whereas synaptophysin levels were comparable. (B) BDNF stimulation also increased phospho-cofilin (Ser 3, yellow) intensities (pCof/cofilin–no pulse 1.00 ± 0.03, Q2 1.00, n = 11, N = 174; 5′ BDNF 1.73 ± 0.17, Q2 1.69, n = 11, N = 176; p = 0.0003), but did alter neither cofilin (green) nor synaptophysin (magenta) (scale bar: 5 μm). (C) Representative images of axonal growth cones stained against phospho-profilin (Tyr 129, green) and synaptophysin (magenta) (scale bar: 5 μm). Upon BDNF treatment the levels of phospho-profilin normalized to synaptophysin were enhanced (no pulse 1.00 ± 0.04, Q2 1.00, IQR 0.09, n = 13, N = 200; 5′ BDNF 1.59 ± 0.12, Q2 1.67, IQR 0.57, N = 14, n = 226; p = 0.0012). (D) In BDNF-pulsed growth cones F-actin (magenta) was significantly increased (1.49 ± 0.13, Q2 1.48, n = 9, N = 236; p = 0.0088) in comparison to non-pulsed controls (1.00 ± 0.06, Q2 1.00, n = 7, N = 194), whereas total β-actin (green) and tau (blue) appeared not changed (scale bar: 5 μm). (E) Live-cell imaging of axonal growth cones of embryonic motoneurons cultured for 5 or 6 days in vitro and transduced with lentiviral constructs expressing actin-GFP. Time-lapse series of the same growth cone prior to and after BDNF pulse (scale bar: 5 μm). Upon BDNF application filopodia dynamics appeared reduced indicating actin stabilization. (F) Filopodia dynamics were assessed as multiple kymographs revealing significantly reduced actin movement upon BDNF pulse (no pulse 0.25 ± 0.02 μm/s, Q2 0.27 μm/s, IQR 0.20 μm/s, N = 49; 5′ BDNF 0.18 ± 0.02 μm/s, Q2 0.14 μm/s IQR 0.16 μm/s, N = 44; p = 0.0044).

