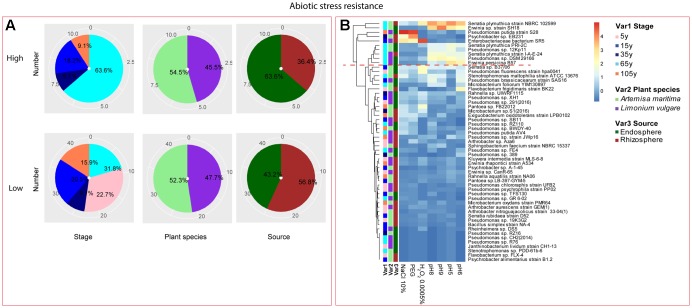
FIGURE 4.
Distribution of abiotic stress resistance of root-associated bacterial strains. (A) Distribution of isolates from different treatments according to high and low activities in abiotic stress resistance. (B) Heatmap profiles for abiotic stress resistance of all isolates. The annotation of treatments – successional stages, plant species and plant compartments were respectively referred as Var1, Var2 and Var3. For successional stages, pink, blue, navy, cyan and orange color represent 5, 15, 35, 65, and 105-year stage, respectively. For plant species, purple refers to L. vulgare and green to A. maritima. For plant compartments, red refer to rhizosphere and green to endosphere isolates. The blue-red gradient bar represents the normalized absorbance values (Z-scores). Only the integer scaled values (0–4) were shown alongside the color bar. The red dashed line separates the high and low bacterial functional profiles, which were determined by the cluster assignment based on the average Euclidean distance among the bacterial strains.

