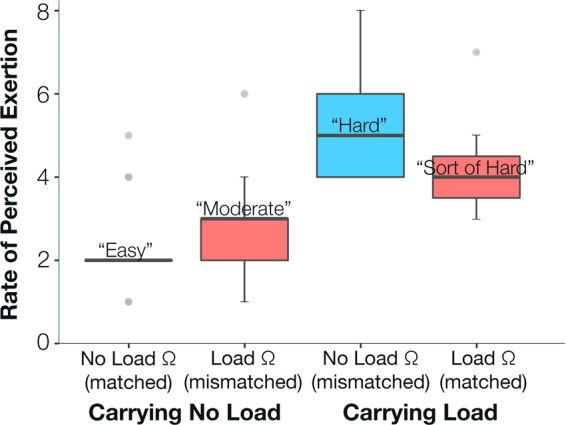
Figure 2.

Both load and prosthetic knee mechanics significantly affected subjects’ rate of perceived exertion. Rate of perceived exertion distribution summary of all subjects shown for all four testing conditions. Red indicates load impedance parameters, and blue indicates no load impedance parameters. Matched conditions were conditions in which amputee subjects walked with powered knee impedance parameters tuned for the load they were carrying. Mismatched conditions were conditions in which amputee subjects walked with powered knee impedance parameters not tuned for the load they were carrying. Gray dots beyond the whiskers are data points greater than 1.5 times the interquartile range (i.e. colored regions).
