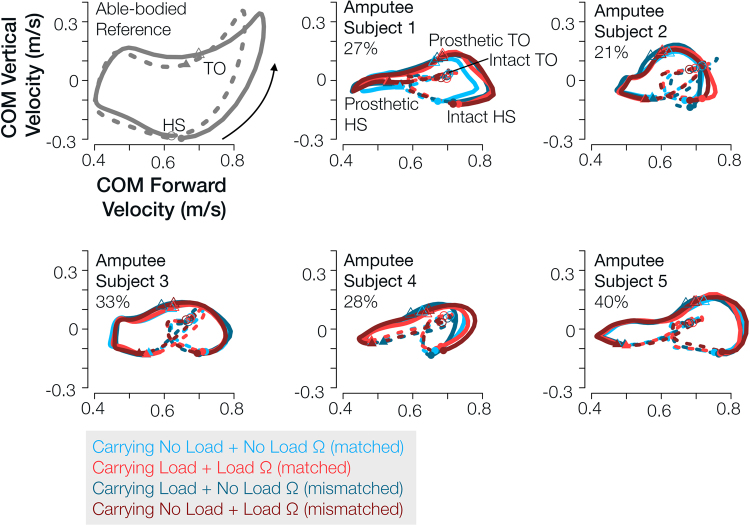
Figure 3.
Center-of-mass forward and vertical velocity remained relatively unchanged between testing condition, but varied across subjects. Center-of-mass vertical velocity plotted against center-of-mass forward velocity for each amputee subject and testing condition. An able-bodied person’s center-of-mass hodograph included in top left (gray) for reference. Forward velocity asymmetry (2) during mid-stance is included as a percent in the top left of each plot. Each limb’s stance phase follows a counter-clockwise loop from heel strike to toe off. Filled point characters indicate heel strike and open point characters indicate toe off. Circles correspond to intact limb gait events, and triangles correspond to prosthetic limb gait events. Solid lines indicate intact-limb initial double support phase and single support phase, and dotted lines indicate prosthetic-limb initial double support phase and single support phase. Red indicates load impedance parameters, and blue indicates no load impedance parameters. Lighter colors correspond to the testing conditions in which amputee subjects did not carry load, and darker colors correspond to the testing conditions in which they carried load.

