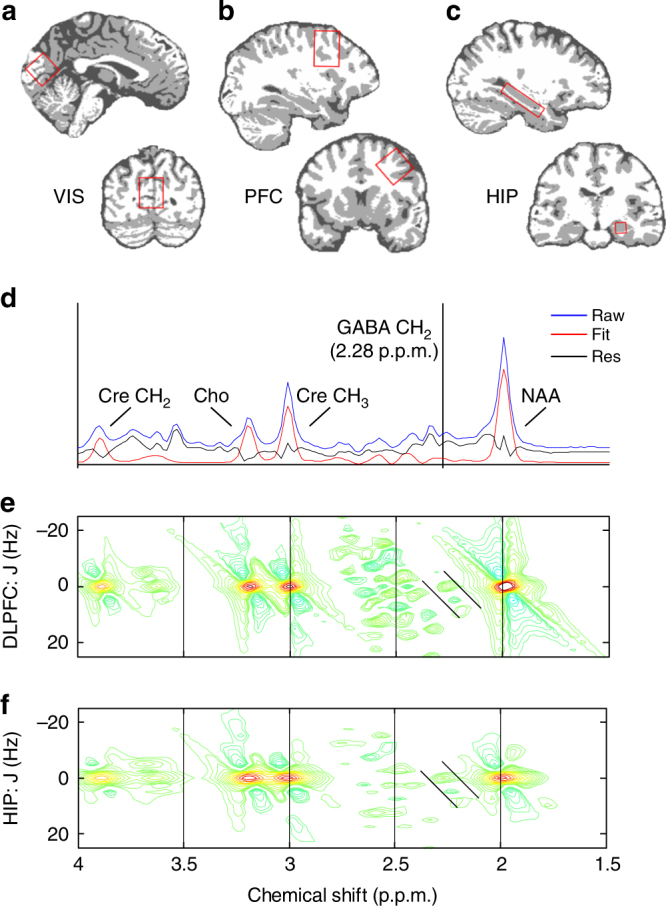
Fig. 2.

1H MRS quantification of GABA concentrations. a–c Positions of the visual cortical, DLPFC, and hippocampus (HIP) voxels are displayed on sagittal (top row) and coronal (bottom row) slices extracted from an example subject’s tissue segmented structural scan. d An example of the 1H MRS spectra displayed in one dimension. Blue line: raw metabolite spectra for an example subject. Red line: ProFit basis functions for singlet (one-peak) metabolites, including Creatine (Cre), Choline (Cho), and N-acetyl aspartate (NAA). Black line: residuals after fitting. Note the GABA CH2 methylene group at 2.28 PPM is invisible on the 1D plot. e and f Plotted for the DLPFC (N = 23) and HIP (N = 18) voxels are the fitted spectra (averaged overall subjects) of the same four metabolites, but now spread along two dimensions, the J-resolved axis (±20 Hz) plotted and the chemical shift axis (1.5–4 parts per million; p.p.m.). Both plots use identical scaling. Colors indicate minimum (blue) and maximum (red) height of spectral contours (arbitrary units). The GABA CH2 methylene group is visible at 2.28 p.p.m. (diagonal lines)
