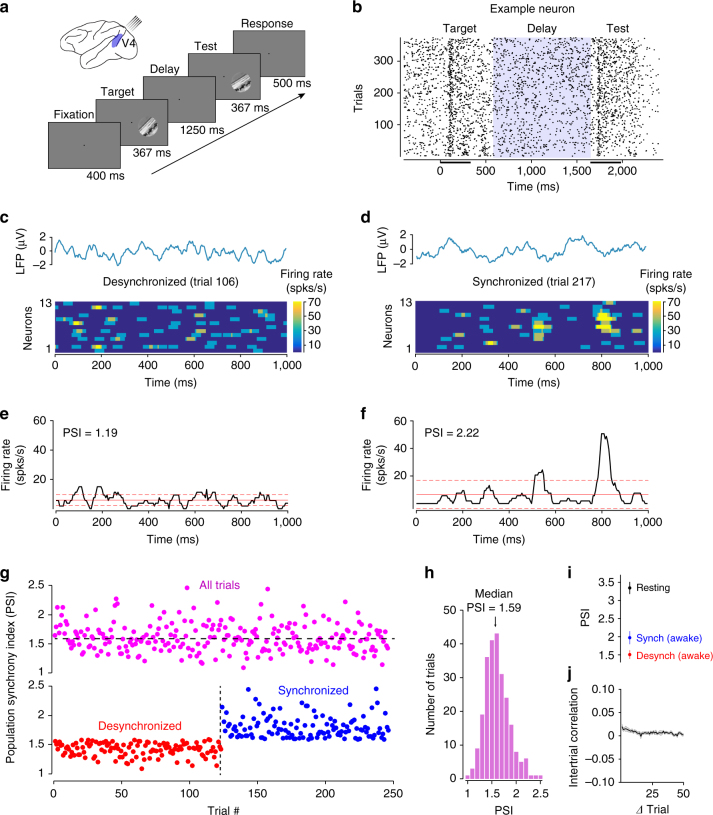
Fig. 1.
Trial-by-trial fluctuations in population synchrony in visual cortex. a Schematic representation of the recording site and experimental design. Animals were trained to report whether two briefly flashed successive natural scenes (target and test) were identical or different. b Raster plot of one example neuron. The blue shaded inter-stimulus delay period was used to measure population synchrony in each trial. The black bars under the x axis mark the time intervals when the two stimuli are presented. c, d Population response measured in individual trials from the same session—the neural population is desynchronized in trial 106 c and synchronized in trial 217 d. The blue traces represent local field potential responses from the individual trials. e, f Population firing rate as a function of time for the example trials in c and d. The population of cells is desynchronized in trial 106 (PSI = 1.19, e) and synchronized in trial 217 (PSI = 2.22, f). The solid red line indicates the population mean firing rate; the red dotted lines indicate 1 s.d. from this mean. g top Trial-by-trial PSI for the example session from c–f. The horizontal line represents the median PSI value. Bottom: Trial-by-trial PSI after dividing the session into desynchronized (PSI below median) and synchronized trials (PSI above median). h PSI histogram for the example session in c–g. i Average PSI across sessions for desynchronized (red) and synchronized trials (blue). These PSI values are compared to the mean PSI when animals rest for a 20–30 min period (black). Error bars represent standard error. j The mean autocorrelation function (across sessions) of trial-by-trial PSI

