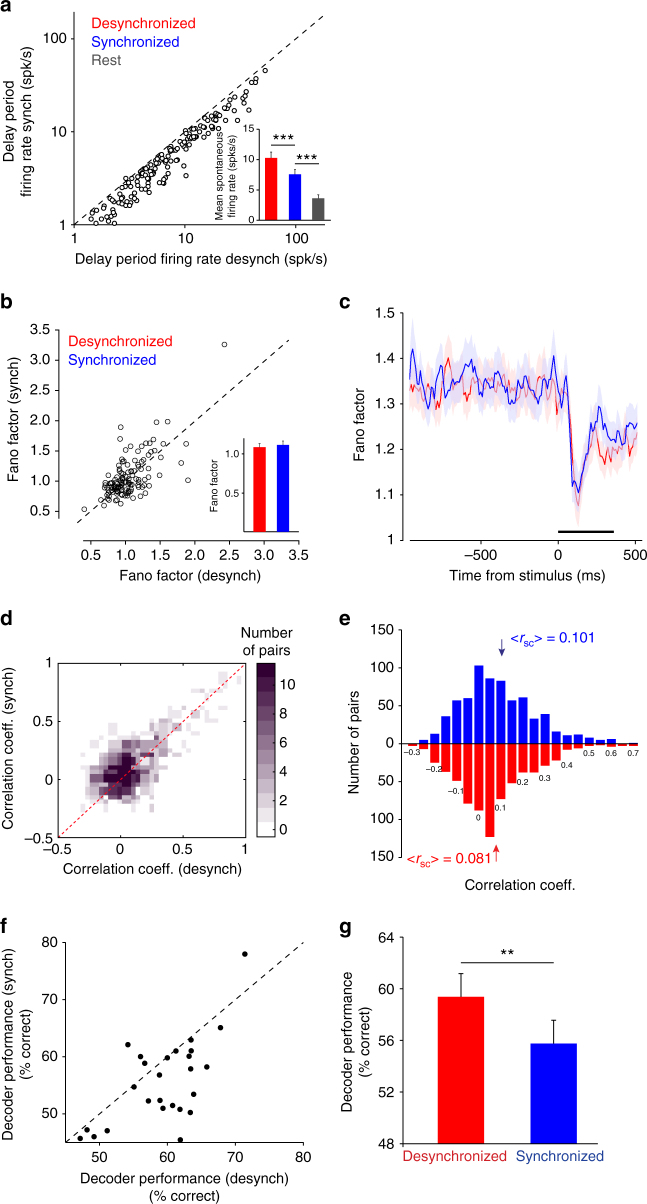
Fig. 2.
Cortical state impacts the ability of the population of cells to extract sensory information. a Firing rates are higher in the desynchronized cortical state. The scatter plot pools data across sessions (each circle represents one neuron). Inset, mean firing rates of neurons in desynchronized and synchronized trials (***P < 0.0001). b Fano factor (variance/mean) in the synchronized states plotted as a function of Fano factor in the desynchronized state for the test stimulus presentation. Inset, average Fano factor for each state (P > 0.05). c Fano factor plotted in a 50 ms sliding window (step size 10 ms) for the 1 s before test stimulus presentation (black bar) to 500 ms past stimulus onset. d Three-dimensional histogram of the correlation coefficients plotted for the synchronized and desynchronized states. The z axis represents the number of pairs in each correlation coefficient window. The dotted red line represents unity. e Histogram of the evoked correlation coefficients for the synchronized and desynchronized trials. The arrows represent the mean <r sc> for each group. f Scatter plot of decoder performance (% correct classification) in the synchronized vs. desynchronized state. Each circle represents a session. g Average decoder performance was significantly higher in the desynchronized state (**P < 0.005). Error bars represent standard error

