Fig. 3.
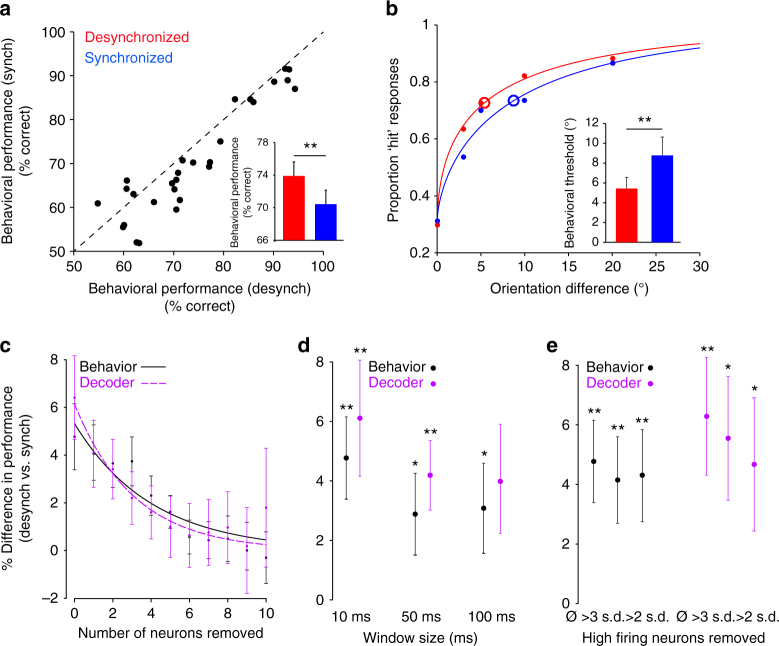
Population synchrony impacts behavioral performance. a Scatter plot of the behavioral performance (% correct responses) in synchronized vs. desynchronized trials. Each point represents one session. Inset, mean behavioral performance is significantly higher in desynchronized trials (**P < 0.001). Error bars represent standard error. b Psychometric curves associated with the synchronized and desynchronized cortical states. Large circles represent the psychometric thresholds. Solid dots represent the cumulative proportion of hit responses across trials and sessions for each orientation difference. We did not include the 2° orientation difference since it was only used in four sessions (however, the difference in the proportion of hit responses between desynch vs. synch trials was 5.6%). Inset, average behavioral performance threshold is significantly lower in desynchronized trials (**P < 0.005). c Percent difference in behavioral and decoder performance between the desynchronized and synchronized trials using the cell-dropping procedure (behavior: black; decoder: purple). The two curves represent exponential fits. Error bars represent standard error. d Percent difference in behavioral and decoder performance between desynchronized and synchronized trials for different window sizes to define PSI (**P < 0.005, *P < 0.05). e Percent difference in behavioral and decoder performance between desynchronized and synchronized trials after removing the high-firing rate (outlier) neurons from the population. Ø represents no neurons removed, >3 s.d. and >2 s.d. represent removing neurons with average spontaneous firing rates >3 s.d. and 2 s.d. above the population mean (**P < 0.005, *P < 0.05)

