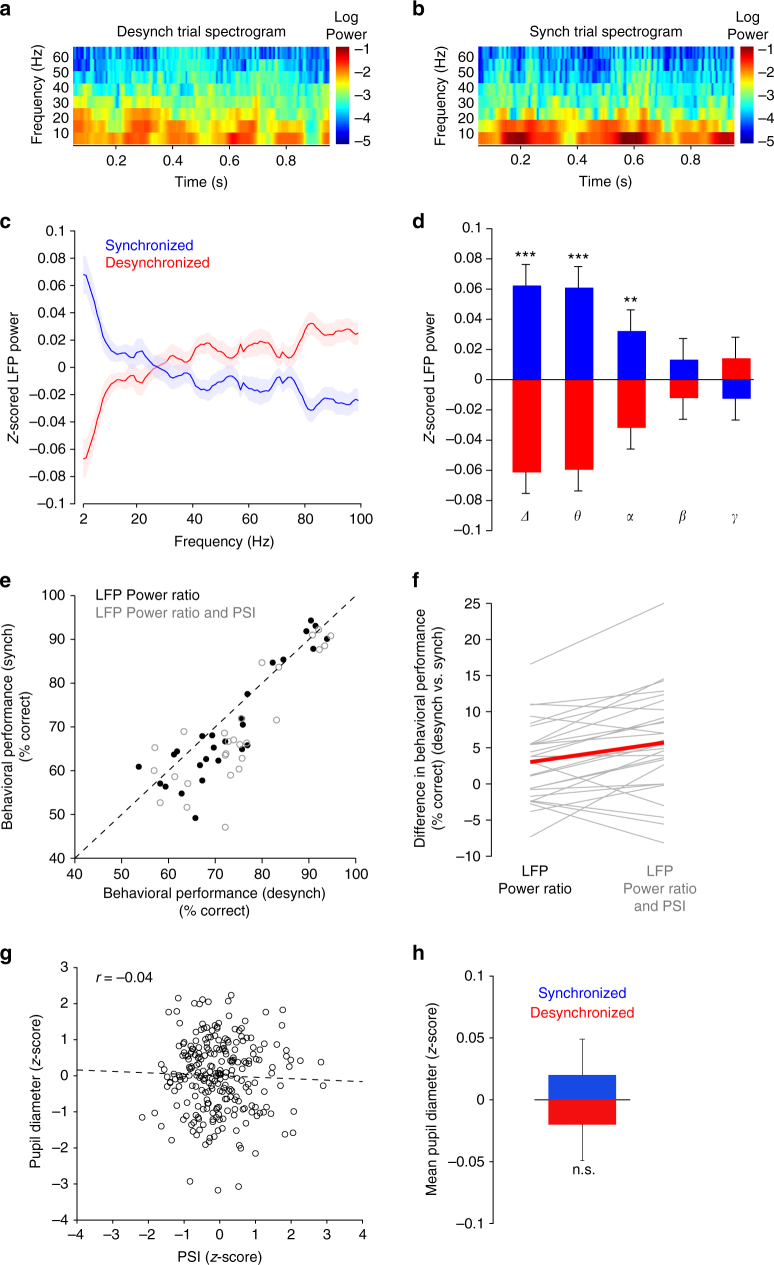
Fig. 4.
Using LFP power to characterize the functional impact of population synchrony. a Example time-frequency spectrogram for a desynchronized trial averaged across all recording electrodes. The power ratio for this trial was 0.799 (P2–10Hz/P10-70Hz). b Example time-frequency spectrogram for a synchronized trial averaged across all recording electrodes. The power ratio for this trial was 3.273 (P2–10Hz/P10-70Hz). c Z-scored LFP power in synchronized and desynchronized cortical states (defined by PSI). LFP power was calculated using a 5 Hz rolling window size with a step of 1 Hz. Shaded areas represent standard error. d Z-scored LFP power in physiologic bands for synchronized and desynchronized trials (as defined by PSI) (Δ = 2–4 Hz, θ = 4–8 Hz, α = 8–12 Hz, β = 12–30 Hz, γ = 30–100 Hz) (***P < 0.0001, **P < 0.005). e Black dots: scatter plot of behavioral performance (% correct responses) in desynchronized/synchronized cortical states (defined by the LFP power ratio). Each point represents one session. Gray circles: scatter plot of behavioral performance in desynchronized/synchronized cortical states. Trials were selected only if they shared the same state of synchrony using both the PSI and the power ratio methods. f Difference in average behavioral performance (% correct responses) between synchronized and desynchronized states was higher when cortical state was assessed using both the PSI and power ratio methods (*P < 0.01; **P < 0.0005). The red line connects the mean of each category. g Example session showing z-scored pupil size as a function of PSI for all trials (all measurements were performed during the delay period). There was no significant correlation between the two variables (r = −0.04, P = 0.5283, Pearson correlation). h Across sessions, the mean pupil diameter in the synchronized state was not significantly different than the mean pupil diameter in the synchronized state (P = 0.5124, paired t-test)

