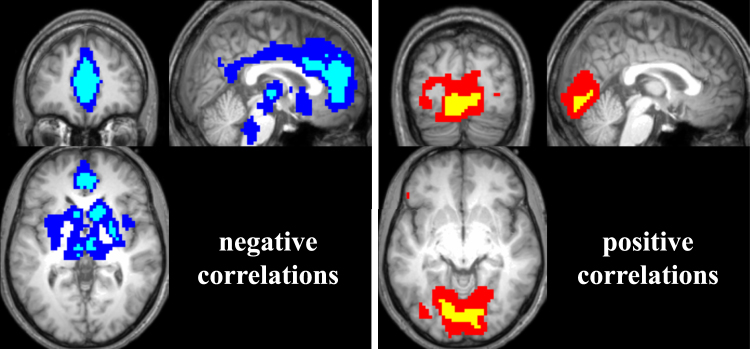
Figure 5.
Significant correlations of CBF with SWA. Left panel: Depicted are areas where CBF was negatively correlated with SWA (blue: p < 0.01 uncorrected, cyan: p < 0.05 FWE corrected, cluster extent of 20 voxels). Slices were positioned at MNI coordinates x: 2, y: 45, z: 0. Right panel: Depicted are areas where CBF was positively correlated with SWA (red: p < 0.01 uncorrected, yellow: p < 0.05 FWE corrected, cluster extent of 20 voxels). Slices were positioned at MNI coordinates x: 2, y: −82, z: −8. 19 subjects contributed to this analysis.

