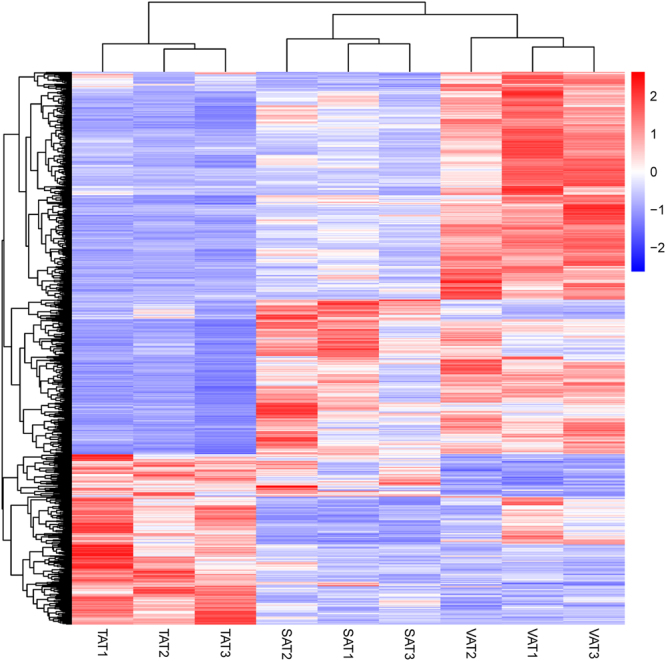
Figure 3.

Clustering analysis of 1,058 DEGs in three adipose depots. Genes and samples were clustered in columns and rows using the MultiExperiment Viewer (MeV 4.9.0). The dendrogram was created to intuitively reflect the global expression patterns of DEGs in nine adipose libraries. All libraries are orderly labeled with SAT2, SAT1, SAT3, VAT3, VAT1, VAT2, TAT3, TAT1, and TAT2 at the bottom of each column. Up- and down-regulation are separately colored in red and green.
