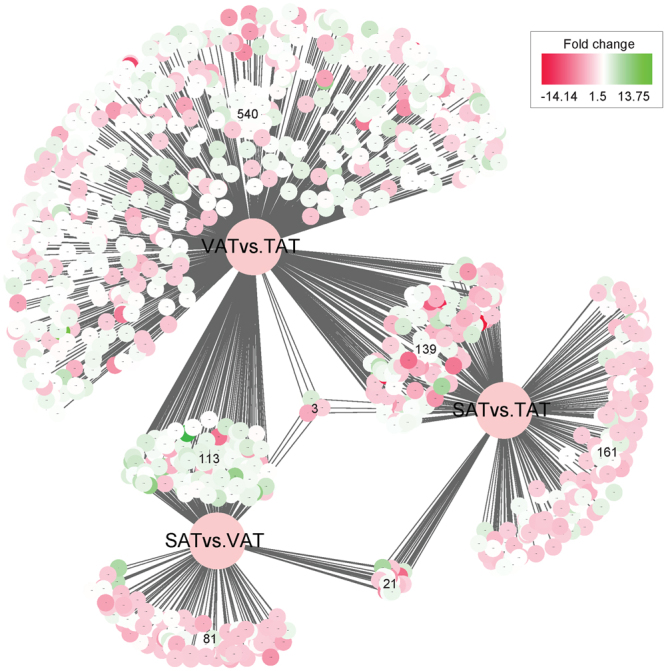
Figure 4.

The distribution of DEGs and their fold changes between three adipose depots. A total of 1,058 DEGs were identified in SAT vs. VAT, SAT vs. TAT, and VAT vs. TAT. A large pool of 795 genes was exclusively expressed in the VAT vs. TAT, while a smaller proportion of 218 and 324 genes was expressed uniquely in the SAT vs. VAT and SAT vs. TAT respectively. Three genes shared in all three tissues. Color-coding denotes fold change between any two of the three adipose depots.
